

A deeper look into Transocean
and evaluating their future


This is part 1 of a series on offshore drilling companies.
Finviz only shows 9 other oil drillers in their stock screener. This is because drilling for oil has fallen out of fashion and has seen lots of bankruptcy and consolidation. When shale hit the scene, the demand for offshore oil and gas dropped. In addition, the shale revolution dropped the price of oil making many offshore projects untenable. The battle for oil dominance between shale companies and Saudi Arabia came to its conclusion in March/April of 2020 when the price crashed through the floor. Since that time, shale has been a shell of its former self. One of the best metrics is the “Drilled but Uncompleted (DUC) Wells” statistics.

This chart is poorly constructed and slightly out-of-date but it was the best that I could find in a pinch. We are currently looking at roughly 4400 DUC wells which is slightly less than what that figure was in January ‘22. The EIA updates their “Drilling Productivity Report” monthly (link here). The reason that DUC well stats are important is that shale oil production requires companies to constantly drill new wells. This is due to the steep production declines that shale producers experience when it comes to shale oil. The wells run dry much quicker than conventional methods. The fact that companies aren’t increasing their DUC wells means that drilling new wells has become prohibitive. This could be due to many factors including; government mandates, loss of productive areas to drill, higher costs, or a combination of factors. This sets the stage for higher oil prices.
On the other side of the battle for oil dominance is Saudi Arabia which leads OPEC+ and has been signalling reduced production numbers for several months now. I believe that Saudi Arabia has reached the peak of their onshore production capabilities. Saudi Aramco (Saudi Arabia’s state owned oil company) is now beginning to get serious about exploring offshore production possibilities.
PEMEX and Saudi Aramco secured five jackups each for a total of 15 and 25 years respectively during the past month.
Meanwhile, Saudi Aramco awarded 46 multi-year contracts year-to-date, which constitutes 70% of all Middle East and 45% of all global term jackup contracts.
With production on the decline in both OPEC+ and shale oil, offshore oil is once again becoming attractive. This brings me to Transocean (RIG) which is a mid-sized company at a $2.78B market cap but is the largest offshore drilling contractor based on sales.
Transocean (RIG) has a fleet of 26 drillships and 13 semi-submersible rigs. Offshore oil drillers contract their fleet to oil exploration & production (E&P) companies for revenue. The contract value is divided by the number of days in the contract to come up with a “day rate”. This is an estimated base cost the E&P company will pay to the drilling contractor. There are often incentives in the contracts if certain goals are met. Also, there can be additional costs to the E&P companies for additional products and services. Here is what Transocean’s fleet looks like according to their latest fleet status report.
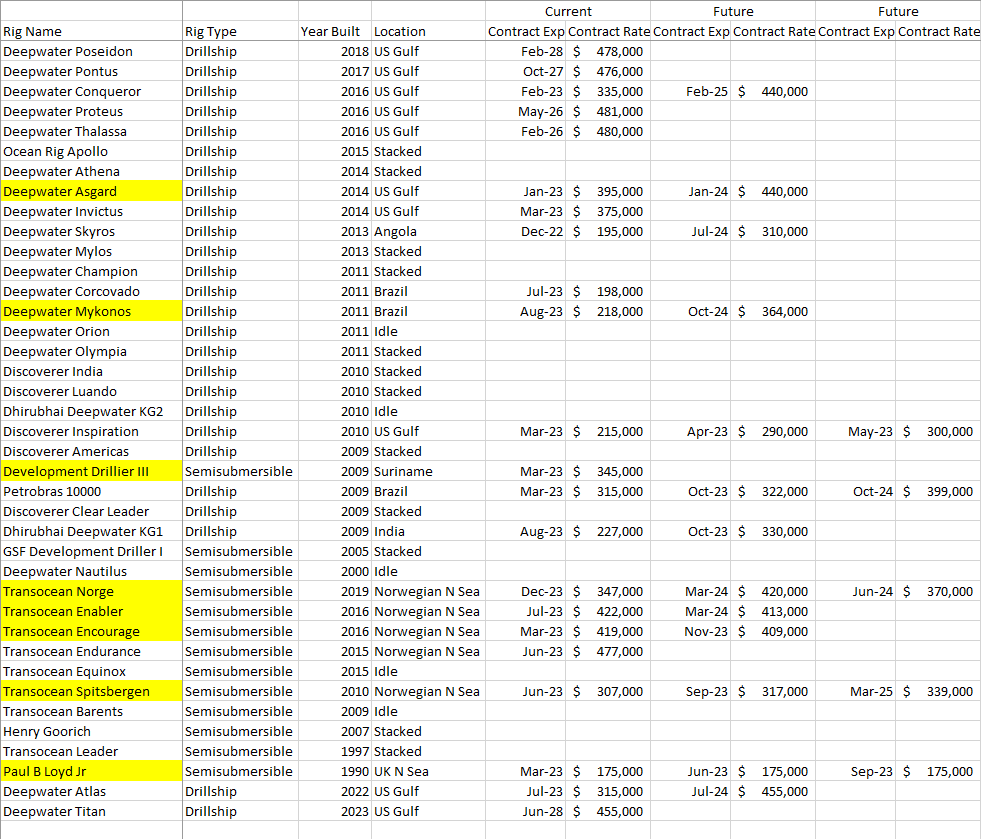
You can see that only 15 drillships and 7 semisubmersibles are currently under contract. The others are either “stacked” or “idle”. Stacked means that the rig has been stored and is manned by a reduced crew or unmanned. Idle means that the rig has a crew and is primarily between contracts. This means that Transocean is only utilizing 56% of its fleet. According to their latest quarterly report, they posted an “rig utilization” rate that was similar to my calculation.

A note on the highlighted rigs, these are rigs that have fixed price options which are options for E&P companies to execute at the end of the scheduled contract to continuing utilizing the rig for an extended period.
Transocean’s low utilization rate exposes them to the fluctuating future contract rates that the industry could experience. They’ve offset some of this with the largest contract backlog in the industry.

This means they’ve been contracted for work and that worked has not yet been completed. These figures are in millions, which means the current backlog is valued at $7.27B.
This is quite a sizable sum seeing that the past annual drilling revenue clocked in at $2.5B-$3B. Here is a P&L report I put together comparing the past 7 years.

You can see from the P&L that it has been over 5 years since RIG has been a profitable company. The company’s balance sheet tells a similar story.

They have seen a steady decline in cash and equity. The other thing that jumps out to me is the long-term debt. It has a big spike in 2018 when Transocean acquired two companies; Songa Offshore and Ocean Rig. Thankfully, they look to be steadily paying down this debt. Using the past as a guide, I now want to look towards the future.
Using RIG’s own figures, I was able to create the following:

“Operating Days” is directly from their annual report. Same is true with “Avg Daily Revenue”. “Operating Costs” came from the P&L reports. Using those figures, I divided the operating days by 365 to give me an approximate number for the “Operating Rigs”. I then divided the “Operating Costs” by the “Est Operating Rigs” to come up with an estimated “Operating Cost per Rig”. This figure is in millions. With this I estimate that it costs Transocean roughly $85.6M/year to operate a rig. I believe that this could be low as costs are rising.
With this in hand, I began to estimate future income for Transocean.
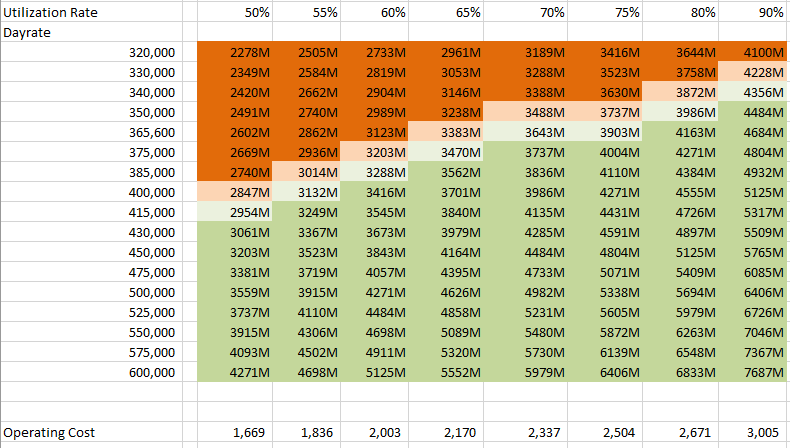
Along the top is the fleet utilization rate. Along the bottom is the operating cost. As more of the fleet is utilized, the operating costs rise. This is from the previous “Operating Cost per Rig” estimate.
Using the 2022 Estimated P&L, I’ve highlighted in dark orange is where Transocean would not be profitable. Light orange and light green show where utilization and day rates would need to be to be roughly breakeven. Dark green highlights show where Transocean would be very profitable. Currently Transocean is at roughly 55% utilization rate and an estimated average day rate closer to 340,000. This puts them firmly in the unprofitable category.
As part of their last annual report, Transocean projected where the average contracted dayrates were headed.

Using the above rates, Transocean would be in the roughly above breakeven category by next year with no change to their fleet utilization. If they increased their fleet utilization at the same time, they could easily become much more profitable. Further consideration will need to be taken with regards to additional costs that RIG may encounter due to the rising cost environment we find ourselves in. I feel this is going to be especially true when it comes to labor for Transocean.

Full disclosure;
I own shares of RIG. Also, I am not a certified financial adviser. The above should not be construed as investment advice. Full legal and disclaimer found here.
Why won't oil companies drill? https://blog.gorozen.com/blog/why-wont-energy-companies-drill
Excellent analysis!