

CPI, BTU, and Retail Sales


The Consumer Price Index came in at 6.4% for the month of January. It was the lowest reading since October 2021. It was a small drop from last months’ reading. We continue to see a slowdown in used vehicles. Shelter continues to increase at a fast clip as well as energy.

Looking at the heat-map from BoA, we see that services inflation continues to be the big driver of the increase in the inflation rate.

Year-over-year, it becomes obvious that certain components are cooling off while others are staying hot.

BoA had a great chart tracking Core Goods vs Core Services. To me, it showed that the Core CPI is highly driven by the services aspect of the components.
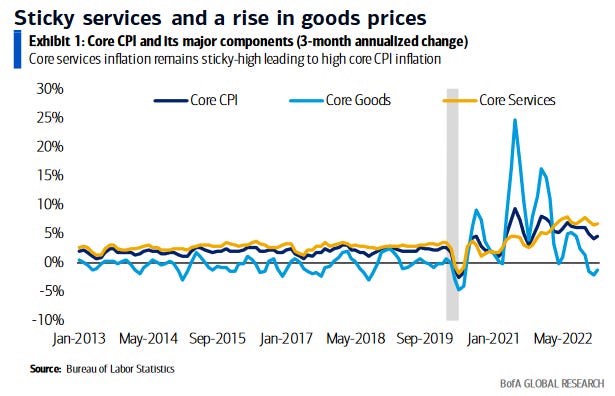
Inflation looks to be more “sticky” than most expected (myself included). We’ll need a few more months’ worth of data but if we are nearing a bottom, then the market is going to need to price in more rate increases from the Fed. This will put tremendous stress on the market. The months of April, May, and June look to be very important. The month of May sees the Biden administration end the Covid emergency powers. June is the end of Libor for interest rate pricing. Meanwhile, we have Congress in a struggle over the debt ceiling.
Today saw retail sales data showed an increase in the year-on-year data to 3.9%. Sales at food and drink places and department stores saw the biggest gain. Month-over-month the gain was 2.3%.

The data shows that consumer spending remains robust. We have a strong labor market, wage growth, and robust retail sales. This certainly gives the Fed another green light to continue to raise interest rates.

Finally, I want to update you on what happened with Peabody Energy’s earnings call yesterday…