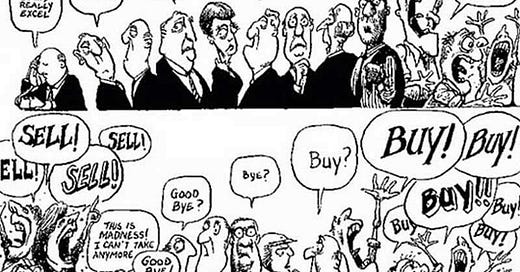
The recent selloff has been furious but is it coming to an end? At the end of the day Thursday and through Friday, a rally took hold in the S&P500. This coincided with a marked drop off in the VIX. Today the VIX is continuing to drop but it seems the S&P500 is mired in more sideways action. I think one of the keys to the recent sell off has been the reduction in trader’s use of margin debt.
We had a 3.3% drop in margin debt usage between March and April. Use went from nearly $800 billion to $773 Billion over the last two months. This has continued the trend through the beginning of the year. Margin use peaked back in October and has been sliding lower ever since. This corresponds well with the drop in the NASDAQ, which peaked in mid-November. As margin use has decline, so has the QQQ. The same could be said of the SPY. It peaked at the end of the year and has been unable to recapture the highs.
Use of margin debt pairs well with the S&P500’s market cap.
This is because margin debt is an important indicator in the confidence of investors. If investors are willing to borrow money in order to put it to work in the stock market, it means they are very confident that the market is going up. Likewise, when traders are unsure, they cut back on margin use and it starts a feedback loop of a stock market correction.
Now the big question is, is this the “Big One”? To know this for sure, you need to keep an eye on the debt market. The debt market is the driver for the stock market. When companies want to easily finance expansions and new projects, they go to the debt market for cash. This drives higher earnings figures and company growth. This, in turn, drives investors to company stocks which are showing growth. When interest rates are low, mal-investment gets baked into the cake. Projects that shouldn’t be viable are able to get financed. These are the seeds of the next recession.
There are a couple good indicators that show the health of the debt market. The one that I seem to gravitate towards is the OAS spread.
The OAS spread is a measure of the difference between a corporate bond or MBS and a “risk-free” Treasury yield. The above graph is the OAS spread for junk bonds. As the spread goes higher, there becomes higher risk and tighter liquidity. Liquidity is the life blood of both the stock market and the debt market. When liquidity dries up, both markets become very difficult to trade. There becomes a flight to “safety”. This usually means cash and cash equivalents, such as T-bills or short-dated Treasury bonds.
While the spread has widen since the beginning of the year, it has not had the dramatic climb that we’ve seen in the past. This makes me lean towards this turbulence in the stock market being a correction and not “the Big One”. We’ll know more next week when the Fed releases the latest money stock figures next Tuesday.
Tomorrow, Fed Chairman Jerome Powell speaks at the Wall Street Journal Future of Everything Festival in New York. I’ll be listening in to see if there is any change of direction. I have a feeling the Fed knows that they are behind the ball on raising interest rates and are attempting to get them up quickly before they will be forced to cut them to zero and restart QE once the recession comes on in full. We’ll see if Jerome gives any insight into the echo chamber that the Fed is locked in.


