
Guess what day it is
Guess what day it is
my favorite inflation indicator and a look at housing data


The Baerlocher Bearing is turning 1 year old today! I created this blog after the passing of Robert Wenzel. My close friend and I were sharing in our sorrow over his passing when I was struck by the idea of picking up where Robert left off. I knew there was a big hole that was left after his passing. There was a giant void now where Target Liberty, Economic Policy Journal, and the Daily Alert had previously resided. I also knew that I was not nearly as talented, articulate, or well versed in Austrian Economics as Robert but I thought I’d give it a shot. I never imagined I would make it a whole year.
I appreciate everyone who has continued to follow and support me. I also value the feedback that many have provided as I’ve attempted to find my groove. Finally I would be remiss if I didn’t also acknowledge those kind people who have donated to this cause. I still work a “9-5” and do this on the side. Those that have kindly given me some of their hard earned money reinforce the idea that my time and effort isn’t for naught. If you enjoy my insights, memes, or find my information informative and would like to donate, you can do so here:

How fitting that on the Bearing’s birthday that the S&P Case-Shiller Home Price Index would drop. This is my go-to inflation index. I believe this index does a superior job tracking inflation over the CPI, PPI, or PCE. The Case-Shiller Home Price index was created by economists Karl Case and Robert Shiller. They track repeat-sales of single-family homes. This index was originally created to study home pricing trends. What they found out was that the pattern of changes in home prices was not related to construction costs, interest rates, or population changes. It solely was influenced by inflation. Robert Shiller outlines this in his book, “Irrational Exuberance”.
Today the index showed that it was not done rising.
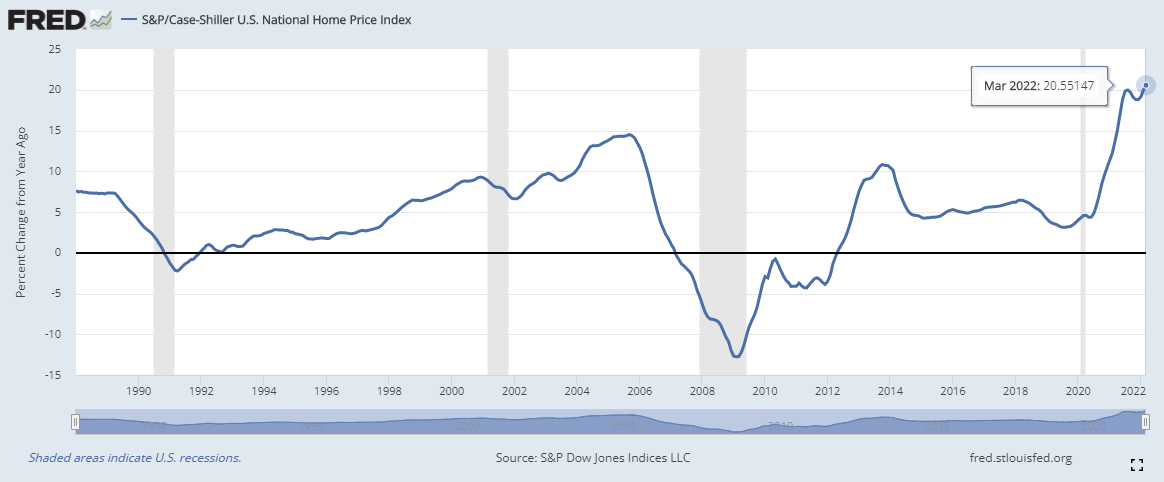
The index rose to 20.6% year-over-year today. This is another new all-time high for the index. Even in the heights of the housing mania in 2006-2008 this index didn’t even reach 15%. Something to keep in mind is that this index is nearly two full months behind our current situation. All inflation indexes are backward looking but this one lags considerably. I would anticipate that this will be the peak. We’ve already begun to see weakness in the housing market. Mish highlighted info coming out of Redfin that shows a large increase in the amount of homes experiencing a sales price drop.

Pending home sales have also seen a big drop.

This has had a pronounced effect on the # of Homes Sold according to Redfin.

The consumer is beginning to get grinded out between high inflation and wages that aren’t keeping up. This became evident last week when the personal income and outlays data showed a big drop in disposable income and the savings rate. This is the self-burnout mechanism that Brendan Brown outlined a month and a half ago.
We can think of the burn-out mechanism as a rise of prices (and possible swing in other variables) which keeps lifting demand for money (in nominal terms) into line with increased supply. The essence of the burn-out mechanism is the destruction of real wealth in the form of money (and government bonds) by the rise in prices. These wealth losses and the need to replenish money holdings in real terms to some extent bear down on demand in goods and services markets.
Due to the influx of cash that was printed by the Fed and distributed by the government in 2020, prices rose. Now a new supply and demand equilibrium is being set. In order for inflation to continue, the government would need to inject more cash to distort the new equilibrium.
Hence inflations can run for a long time and in virulent form. This occurs where the money issuers see net benefit from making new monetary injections even though likely to be less than for the initial one which took so many people by surprise.
The Fed has now begun to tighten down the money supply. We saw this last week with the latest money supply figures. Since this burnout mechanism is now at work, by tightening the money supply, the Fed is walking straight into a deflationary scenario. As interest rates rise, a recession begins to take hold. Projects that were viable under low interest rates will no longer make the cut. Businesses will part ways with employees. Demand will become stifled. However, the inflation that we’ve experienced thus far has mostly been on the supply side. The Fed is attempting to slow the inflation by constraining demand. This will prove to be a dangerous game. Brendan came to the same conclusion I have come to many times in this blog.
The central scenario of this writer is that the pandemic monetary inflation theatre still has several acts before its finale.
One of these would feature the apparent onset of recession and asset deflation to which the Fed responds ultimately by further inflationary injections of money.
This roller coaster is just getting started.

I miss Mr. Wenzel too. You are doing a good job trying to fill his big shoes. You and the Live Better Now guy. I was a subscriber to Wenzel's newsletter and respected his portfolio advice. Do you know of anyone else who offers the same type of advice? I'm an investing idiot and relied on his guidance. Also, ever hear how he died? He looked so healthy in his last videos I still can't believe he would go so soon. Thx Sir. Sent you $10 via Paypal.
I love these insights every day! Happy Anniversary!