

Housing stats look rough


Earlier this week we saw some housing statistics drop. Monday saw the release of the National Association of Home Builders (Nahb) Housing Market Index.
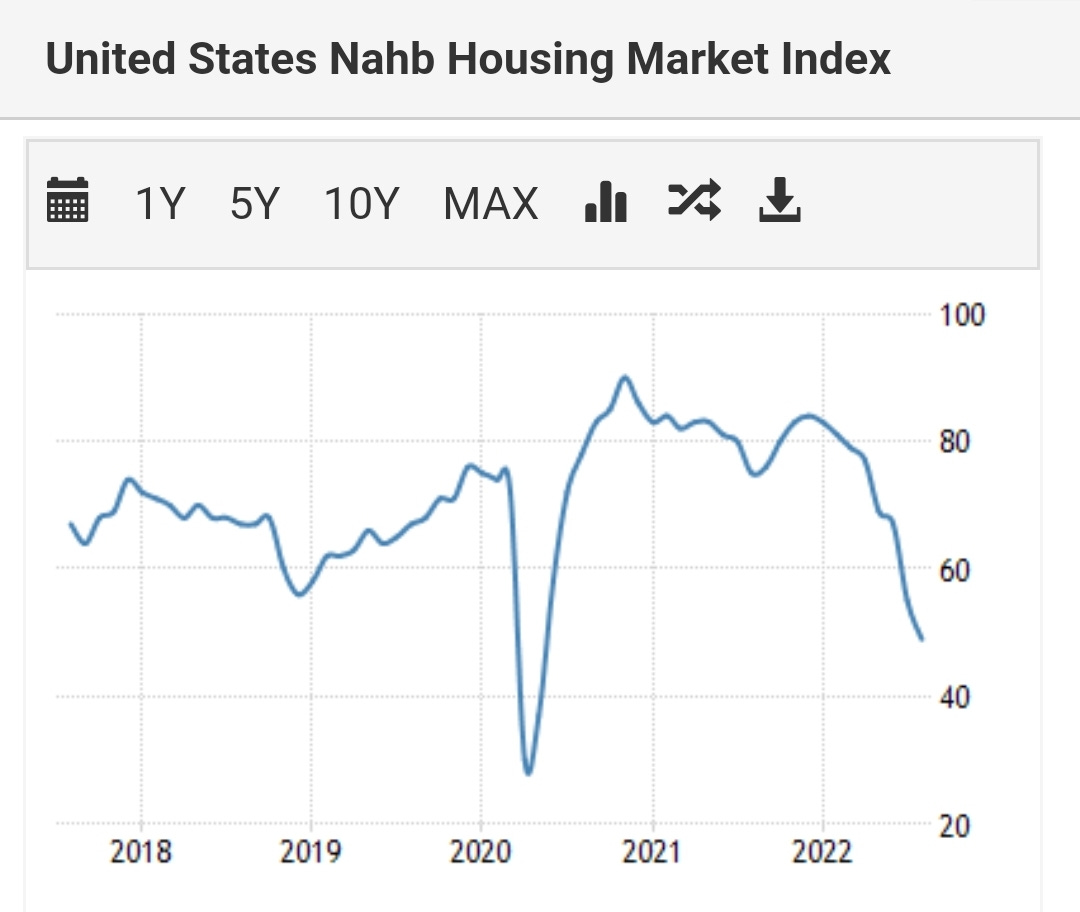
It came in at 49 which was below last month's figure of 55. It has been a sharp drop for the index over the last 9 months when it peaked at 84.
Nahb's index is a survey among builders. It can be volatile and can often throw false signals for the housing market as the builders also take into account their own profitability. Just like other businesses, builders can often feel the pinch between higher costs and slower sales. An example of this is that the index peaked in 2005, well before the actual housing crash of 07/08. However, builder's attitudes toward the market are an important indicator when mixed with other indicators.

Tuesday saw the release of July's building permits and housing starts. These both saw month-over-month decreases. Pairing the actual numbers with the builder's sentiment shows that there is something not right with the housing market.
On Tuesday Redfin also put out their latest figures on the housing market. This is what they had to say:
Home prices nationwide were up 7.7% year-over-year in July. At the same time, the number of homes sold fell 23.3% and the number of homes for sale rose 3.0%.
While the year-over-year price has still shown increases, on the month-over-month we are starting to see the price soften.

Market inventory is also beginning to tick up.
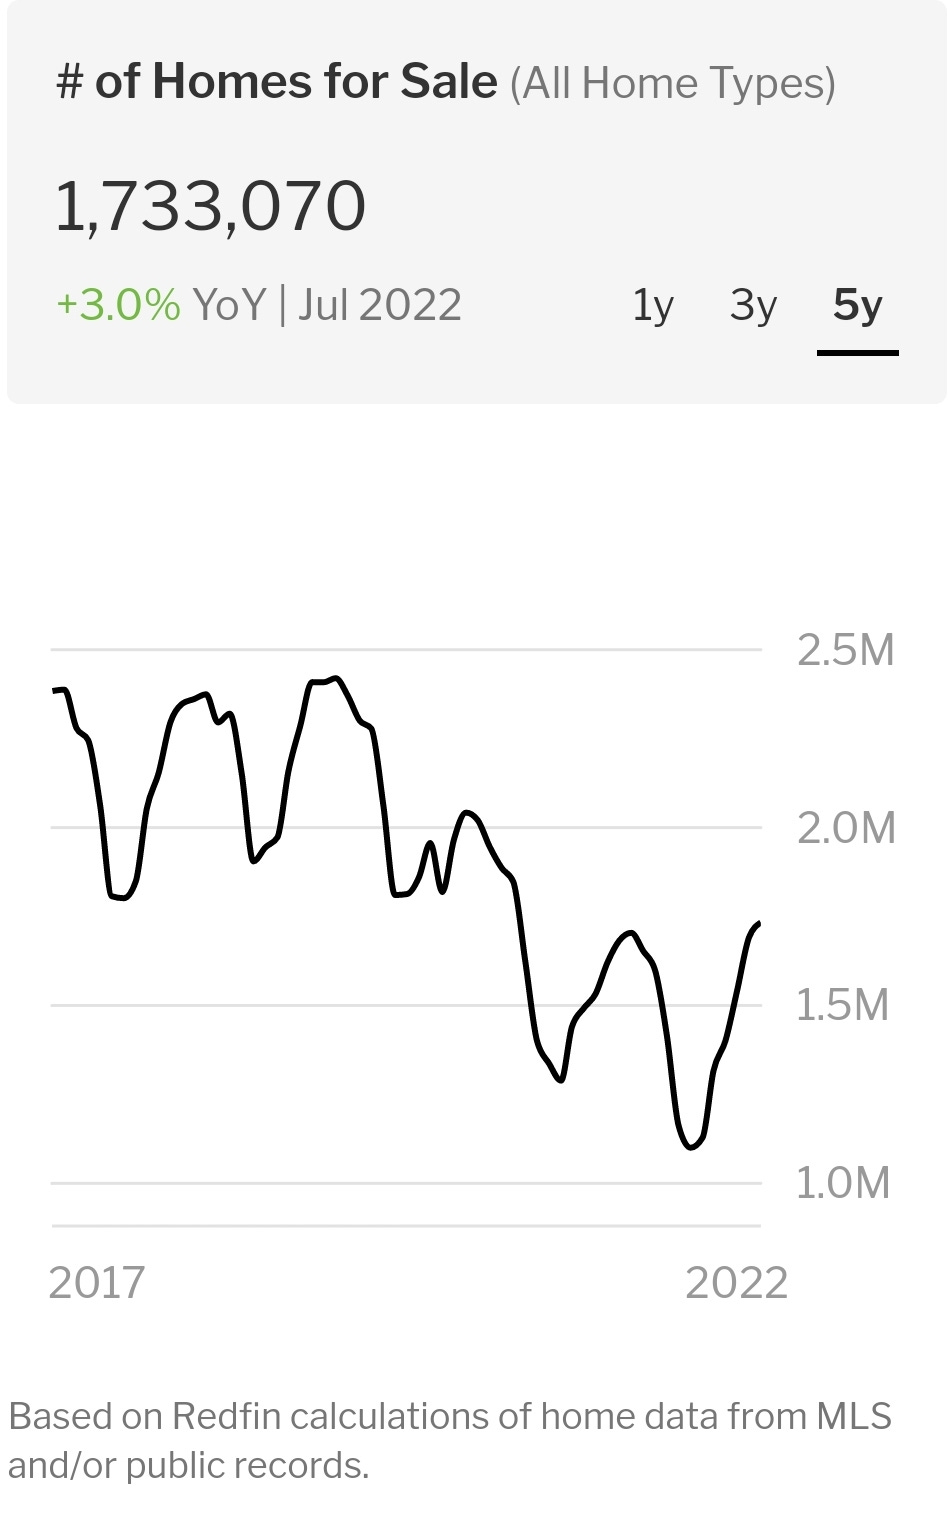
We are now at roughly 2 months’ worth of inventory. Traditionally the long-term average has been 3 months of inventory. In mid-2020, inventory dropped below the 2 month mark. We've seen a tight housing market for 2 years. Over those two years, sellers and agents have grown accustomed to quick sales, short inventory, and above asking price closes. Now that the market is beginning to revert to normal, sellers are cutting prices to maintain the same sales speed.
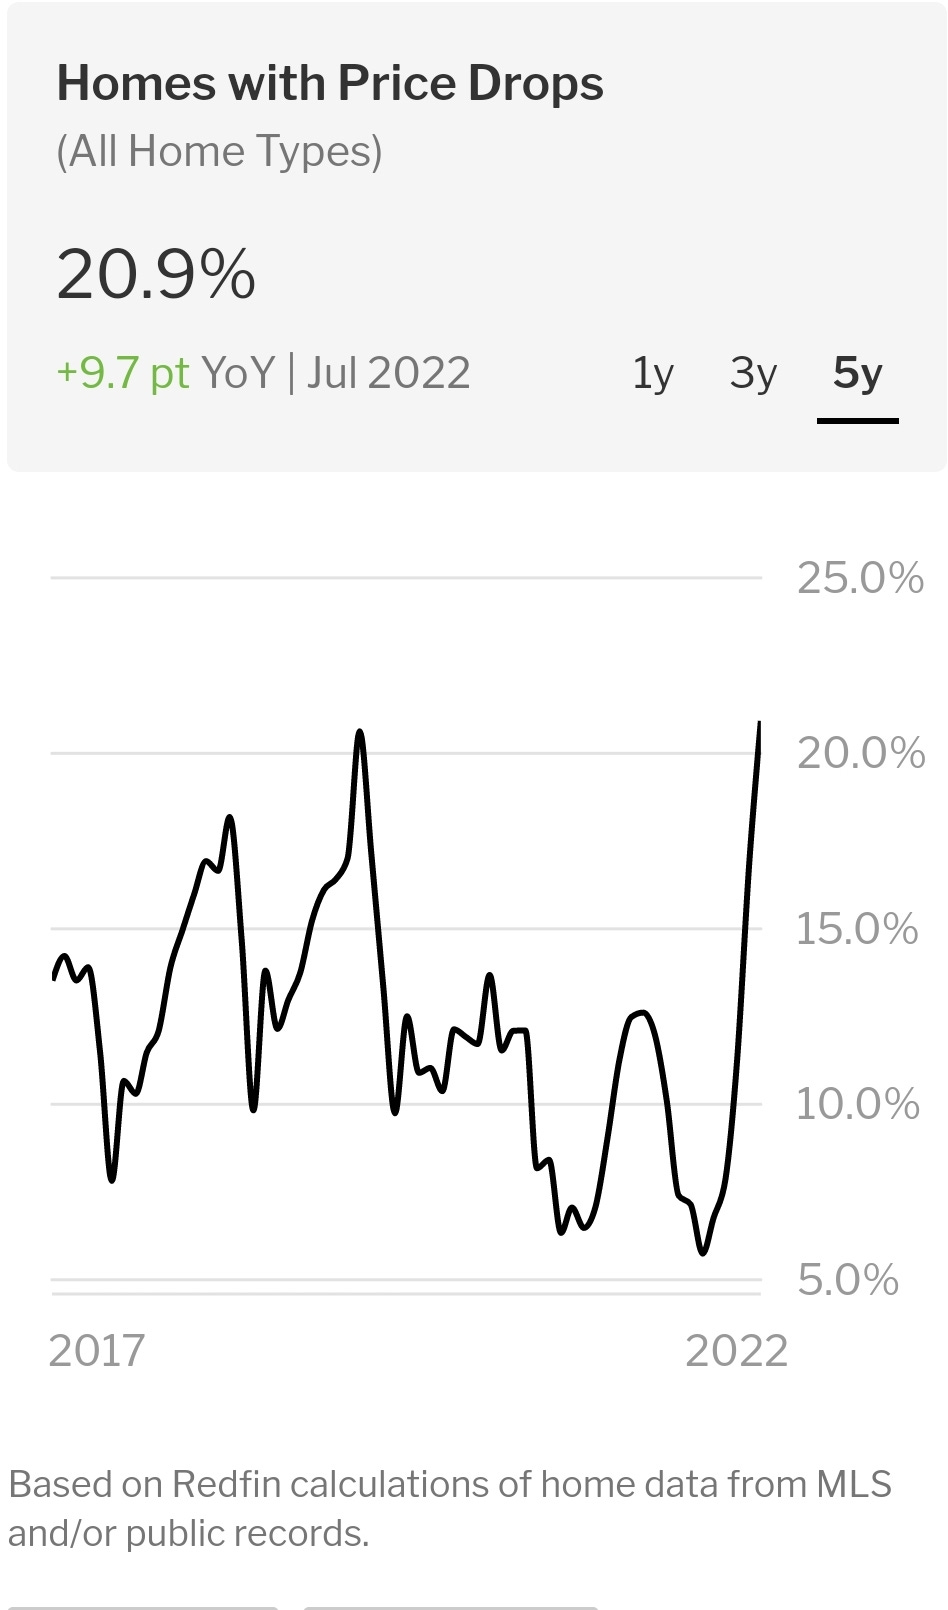
This is causing a dramatic increase in the amount of price drops to move inventory.
The biggest news to come out of Redfin was cancelled contracts.

Nationwide, roughly 63,000 home-purchase agreements fell through in July, equal to 16.1% of homes that went under contract that month. That’s the highest percentage on record with the exception of March and April 2020, when the onset of the coronavirus pandemic brought the housing market to a near standstill.
Today saw the data release on existing-home sales. It shows that existing sales are continuing to trend downward.
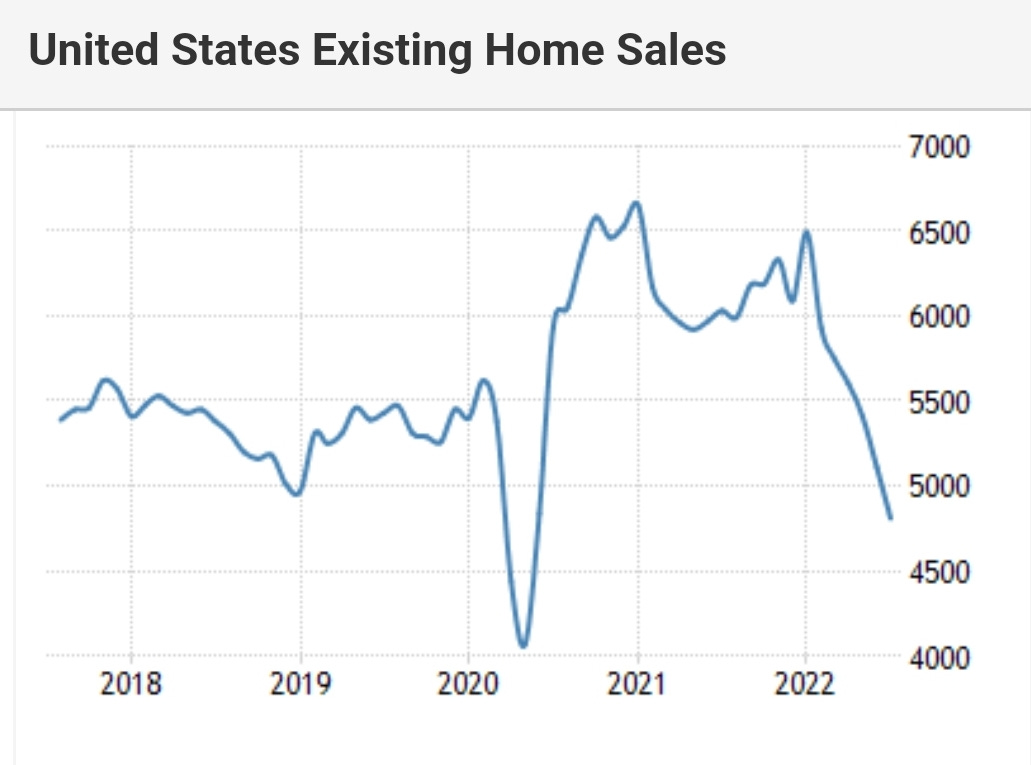
This is the sixth consecutive month of sales declines for existing homes.
There appears to be a lot of turmoil going on in the housing market. There is an adjustment back to the traditional average in inventory and it is putting pressure on sales and prices. In addition, the recent rise in interest rates has forced many to cancel contracts.
The housing market is typically slower to react to changes in the money supply. This is due to liquidity. Stocks and bonds are quick to sell. They are very liquid instruments. They have a much more immediate effect with changes in the money supply. Property and housing is much slower. It takes time to find a buyer and then negotiate the price.
I believe what we are seeing in the housing market is a combination of mean reverting effects and higher interest rates. It appears to me that the effect of the reduced money has yet to truly hit the housing market.
