

Is good news, bad news for the market? A review of the recent market turmoil.
also an update on the yield curve


While the legacy press is continuing to pound fear into the masses about the omicron variant, I believe the recent market turmoil has other factors that are influencing it.
Today saw the release of several employment reports. The unemployment rate has fallen to 4.2%. This steady lowering of the unemployment rate has been a trend since October 2020. We are well into a “normal” range for the unemployment rate. Here is a long-term look with the red-line indicating the current rate.

Many times in the past, this was the bottom for unemployment. The Fed has made employment reports into a big signal to the market. When Jerome Powell indicated that employment was the main figure the Fed was using to decide when to taper, employment reports have become increasingly important to the market.
Now that the Fed has indicated that the pace of the tapering of asset purchases could be increased, traders are concerned what exactly that means. They are trading with the belief that the Fed will increase the taper due to the employment reports showing a return to normal. This is leading to volatile days in the market. Good news on the employment picture and economy is interpreted as bad news for the market as the Fed is more apt to remove accommodative monetary policy.
Not all the news was rosy coming out of these employment reports. One issue Powell has commented on greatly is the participation rate.
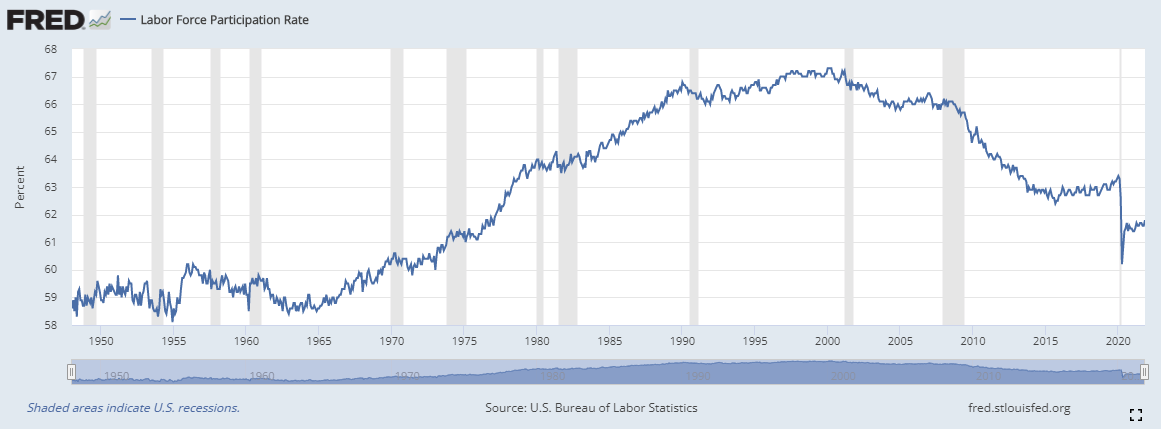
This rate continues to struggle to get back to the pre-government lockdown levels. The participation rate means very little to me but it is the stat “du jour” for the social justice minded. This has caused the Fed to look at it closer and talk about it more. There is more noise than signal here.
What has gotten very little attention is the average hourly earnings. A wage-price spiral comes straight out of the Keynesian textbooks but the indicators have been glossed over as of late.

I’ve plugged in the pre-government lockdown long-term average of 2.5%. The most current reading of year-over-year hourly wage earnings increased to 4.8%. This is tremendous growth in earnings for hourly employees. This is a direct result of the labor shortage. Employers are continuing to bid up wages to attract employees. Typically, as these hourly employees make more, they’ll have more disposable income to bid up the prices of goods and services. Unfortunately, many are already having trouble keeping up with increasing rent, food, and energy costs. A quick comparison to the CPI reveals that many could be falling behind.
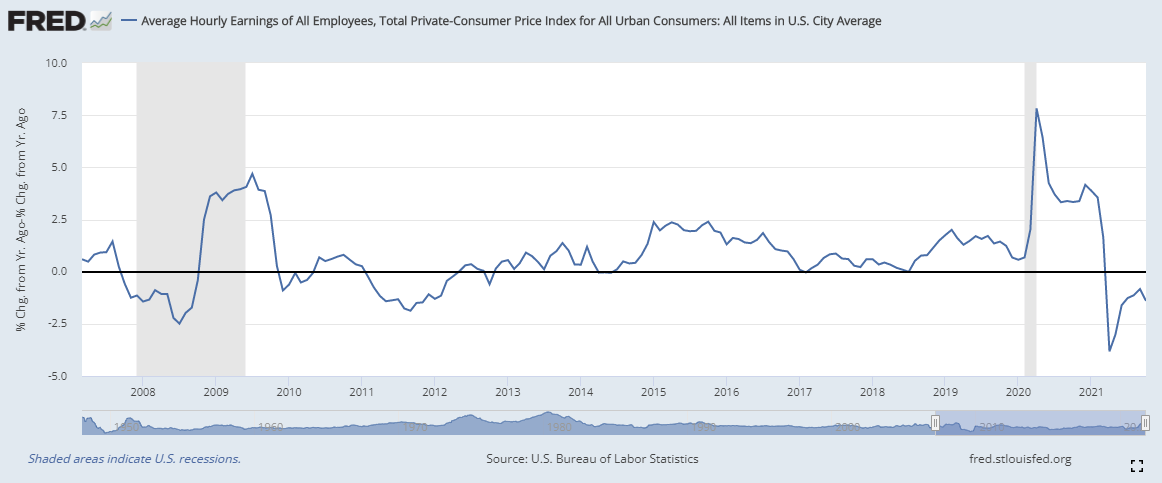
This is the Average Hourly Earnings minus the CPI. When this graph is in positive territory, hourly employees are earning more than inflation. When the lockdowns hit, the CPI crashed. Now the CPI has taken off and wage rates are underwater. While consumers may have more money in their check, they are handling less disposable income. Most hourly wage earners will not be able to withstand a prolonged dip in their earning power. They will get ground down by higher living costs. This is far from the first time this has happened. The data doesn’t go back far enough but the political cartoons do.

In addition to this news, the ISM Non-Manufacturing Survey for November dropped this morning. Their “Prices” component continues to push the historical limits of their data.
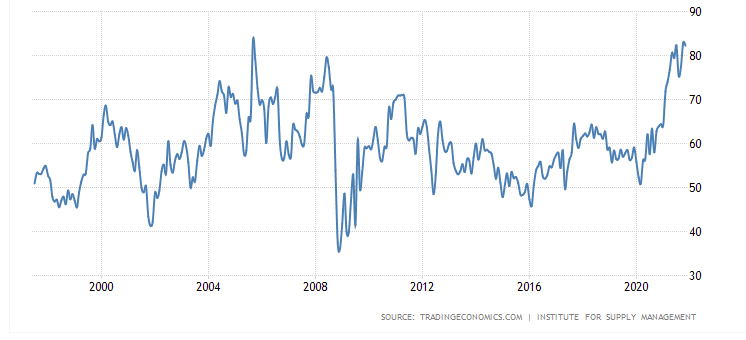
Inflation continues to be a concern for many businesses.
“Prices paid by services organizations for materials and services increased in November, with the index registering 82.3 percent, 0.6 percentage point lower than October’s reading of 82.9 percent. This is the third-highest reading since September 2005, when the index reached its all-time high of 83.5 percent.”
All this data has weighted heavily on market participants. The bond market especially has seen a dramatic turn of events. The 10-year minus the 2-year Treasury has seen a powerful drop as the yield curve continues to flatten.

While we aren’t in negative territory yet (which is traditionally associated with an impending recession), we’ve lost 20 basis points since the beginning of the week. The spread is down to 81 basis points. This action has certainly spooked many traders into a more protective mode. It is also a big indicator that the Fed is making a policy error. All eyes are on the yield curve now.
Hi Alan, curious about your thoughts regarding the inflation vs. deflation debate I am seeing crop up more often across the financial crowd I follow (e.g., Zerohedge, Mish, Doomberg, Quoth the Raven, etc.). The deflation crowd continues to point to the decreasing bond market rates as a sign inflation concerns are overblown. My quick take is bond traders haven't experienced this type of economic environment and thus don't know how to trade in it so we can't put much stock in what that is telling us. If it's easier feel free to respond in a post. I posted this same question to David B on his substack. Thanks in advance!
20 basis points in a week?! Holy shit.