This week was payroll week. JOLTs data came out on Tuesday. Thursday was the Challenger Job Cuts, Continuing Jobless Claims, and Initial Claims. Today saw the release of the Non-Farm Payroll data and the Unemployment Rate.
I updated my ratio of openings to unemployed persons. We continue to trend above 1. This means that there are more than one job opening for every unemployed person in the US. The surplus of job openings over unemployed persons signals a few things to me. First, there might be a skill mismatch. Available workers might lack the skills that prospective employers are looking for, keeping them on the unemployment dole. It could also signal that there is a shortage of workers in certain geographic areas. The unemployed are located in a different part of the country than the job openings are located. Finally, it could also indicate that we are in a period of strong economic expansion. High levels of job creation occur during expansionary periods in the economy.
I was also able to update my Beveridge Curve data.
The curve continues to hold true as the unemployment rate came in at 4.0%. When the job openings data is released at the beginning of the week, the curve is able to help me predict what the unemployment rate will be. This data lends itself to an efficient labor market, allowing the Fed to take their time with regards to cutting rates. It shows that the tight labor market is actually indicating economic expansion and that future wage inflation could be coming as businesses begin bidding for more workers.
Wages continue to grow at an above average rate of 4.1% per year.
This week also saw the release of the nonfarm labor productivity data.
We are seeing a three consecutive quarter slide but I am still optimistic that productivity enhancements will grow. Labor productivity is crucial for several reasons. It is a primary driver of long-term economic growth and allows an economy to produce more goods and services with the same amount of labor, leading to increased output using the same or fewer resources. As productivity increases, businesses can raise wages without increasing costs leading to higher real wage growth. This wage growth then gets put back to work in the economy when workers either invest or spend at higher rates than before.
This past week also saw tariff headlines whipsaw the market. Don’t let the headlines fool you. The economy is in great shape and tariffs should be seen as a way to improve domestic production or bring down prices. The extent to which tariffs contribute to inflation can vary due to many factors such as the duration of the tariffs, the specific goods that are targeted and how businesses, consumers, or other countries respond. The Boston Fed suggested that the tariffs proposed by President Trump could add 0.5 to 0.8 percentage points to the CPI. It seems many have been duped by what these tariffs really represent.
Companies exporting products to the US have a few options with regards to tariffs. They can do nothing and raise the prices of their good in US. Doing this could cost them market share to US competitors. They can also absorb tariff, keep the US prices stable and lose profit margin. Their home country may sympathize with them and subsidizes their business in some fashion such as tax breaks, credits, subsidizes, or other forms of government manipulation of the free market. They could also build production facilities in the US. Maybe they build a facility that just handles the final product step. Finally, they could also lean heavily on their own government to cut some kind of deal with President Trump. Three of these actions boost domestic production. The fourth one keeps prices low. Increased domestic production increases GDP, worker wages, and job growth.
Finally, I want to share two charts with you.
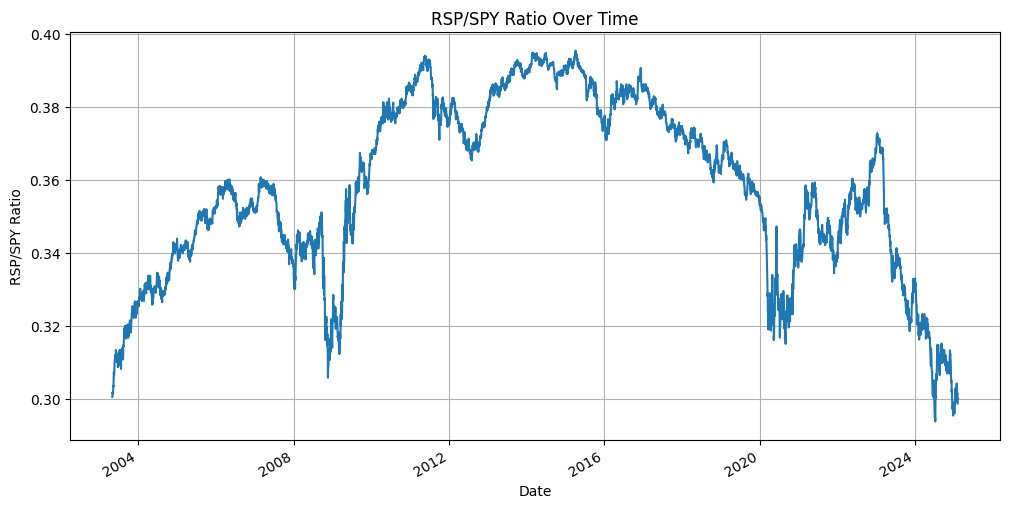
This first one is the equal weighted S&P500 divided by SPY. It shows how passive investing took hold in 2014-2015 and drove investors into the top names of the index. We are hitting points that this index has never seen. If you believe that the market is going to broaden, we should see this trend reverse and RSP to outperform SPY over several years.
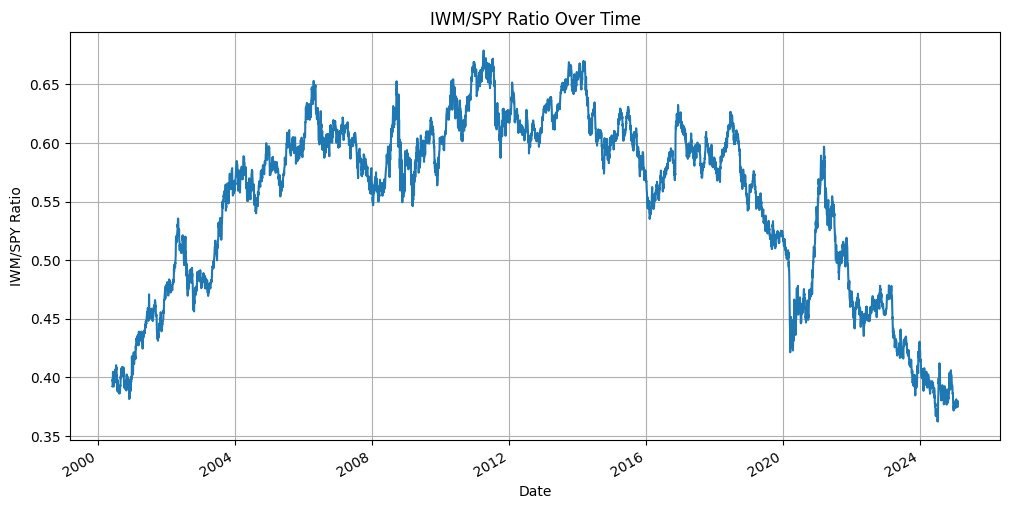
Secondly there is this comparison
which is the Russell 2000 versus SPY. This shows a similar trend. I wish I had a little more time to dive into this one because I think IWM is actually influenced more heavily by the 10Y US Treasury rate than it is the SPY index leaders. Either way, these kinds of market phenomenon don’t last forever and it looks ripe for a reversal.


What do you think is more likely, a rise in the broader stock market or a drop in the top S&P companies i.e. tech stocks?