

Money supply and Margin debt update


On Tuesday the Fed released the H.6 Money Stock Measures which includes the data for the weekly non-seasonally adjusted M2.

Looking at it on a 13-week annualized basis…

shows that it has grown increasingly sluggish.
It’s seasonally typical to see a slow down in the money supply between April and July. I think this is what feeds that narrative to “sell in May and go away”. However, 2024 is much more sluggish than typical. Here’s the observational data YTD:

In the past, this kind of M2 action would be cause for great concern. It would suggest a negative impact to the stock market and if continued, a slowing economy. It is hard to still predict that with what the M2 has done for the past 4 years. Was enough money printed in 2020 to carry the stock market to July of 2024? If so, the bidding up in price of consumer goods should continue.
Meanwhile, stock market traders continue to deploy a large amount of margin debt.
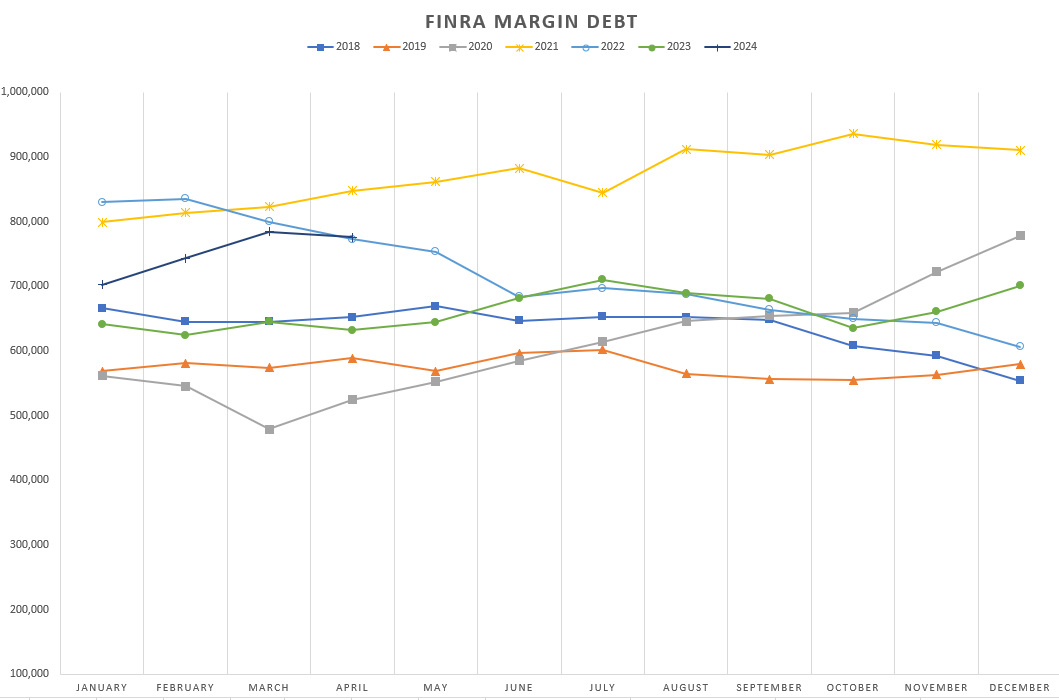

I don't follow the money supply numbers as closely as I used to; I just don't understand how to interpret them since 2020. No matter what they do, the line just keeps going up.