

Money Supply Data
my favorite inflation indicator and a few questions


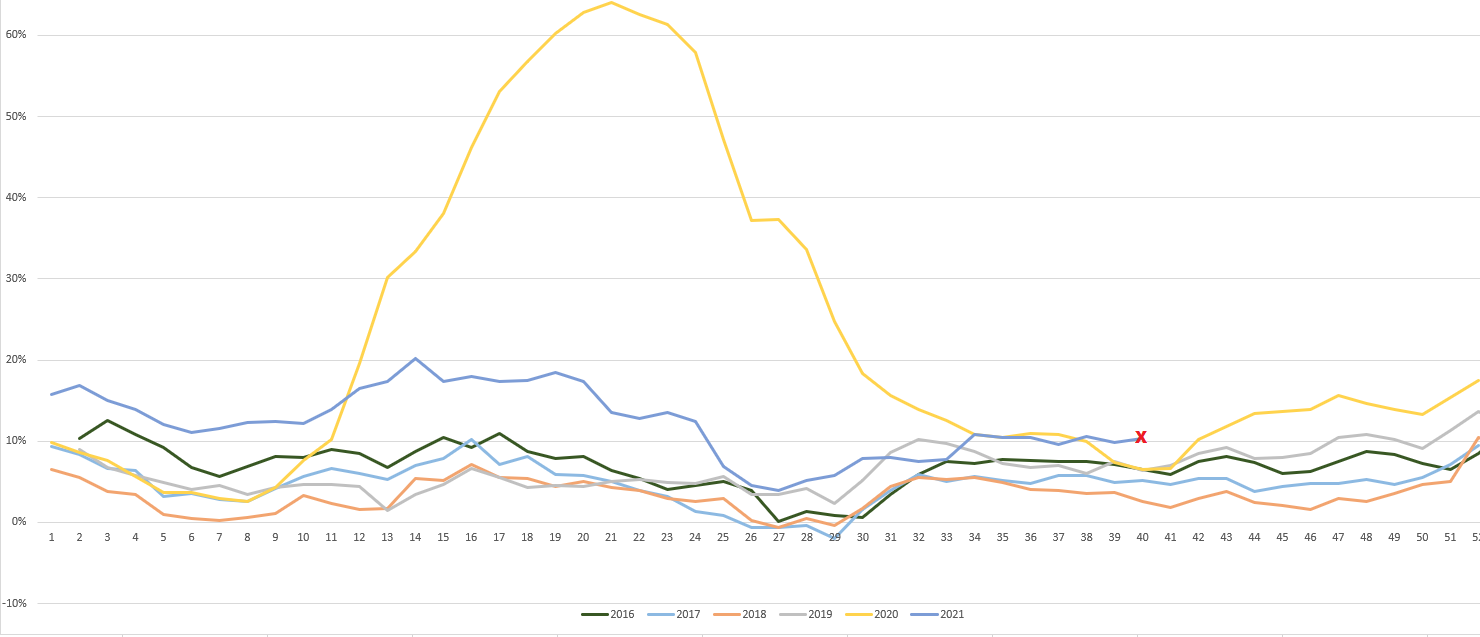
The money supply continues to run hot. The most current reading for my analysis is 10.39%. This is tremendous quarter-over-quarter growth in the supply of money. As you can see from the chart above, we continue our pace above trend. Here is my calculation for the past 10 weeks:

You can see that some of these have been revised from last month’s post. This is due to the Fed adjusting M2NSA figures as they come in. Either way, this is very strong money growth. It proves that the S&P will continue to climb that wall of worry and that liquidity is plentiful. It also secures the fate of commodity prices to run higher.
It is astounding to me that the money supply continues to run this hot. I cannot fathom what it will look like if any of the big spending Democrat bills make it through Congress. We would experience Massive Money Pump 2.0 as the Fed would monetize the spending package.
One of the factors that I believe has muted the inflationary pressure are the shortages. The current slate of shortages have created a slow drip of inflation. This is because retailers don’t want to be labelled as price gougers. I believe that if the shelves were stocked full, inflationary pressure would be greater as consumers would have plenty of goods to choose from.

The S&P/Case-Shiller Home Price Index is my favorite inflation indicator. This is because of two reasons, the way it tracks sales data and the book Robert Shiller wrote, “Irrational Exuberance”.
This index works by tracking sales of single-family, detached homes using the repeat-sales method. That means it compares the sale prices of the same properties over time. It also excludes any sales that aren’t considered “arms-length” sales transactions. That is, if family members are selling to other family members at a discount to the market value, that sale would not be included. However, it does include foreclosure sales. I find that this index was well thought out and well executed. It was first developed by the economists Karl Case and Robert Shiller. Their efforts to create this index were not in vain. This index is an excellent way to assess the housing market and the broader economy.
In addition to the way the index works, the book Mr. Shiller wrote becomes a great companion to it. “Irrational Exuberance” was first published in March of 2000. He’s gone on to revise it to a 2nd (published 2005) and 3rd (published 2015) edition. In the 3rd edition, he expanded on why the use of repeat-sales was so important. He went on to explain that of all the costs associated with building a house and the influence of interest rates on buyers and fluctuations in the population, that none of these compared to the influence of inflation on home prices.
Previously I posted about how well the home price index tracked the CPI. It began to deviate in 1998 when the BLS revised the way their calculated the CPI. So in a way, you could say that the home price index actually tracks inflation better than the CPI.
Below is the latest year-over-year look at the index.

As you can see, this is the highest the index has ever been since the index was formed in 1987. It currently sits at 19.8%. This is an astounding increase in the price of real estate on a year-over-year basis. The Fed and BLS can tweak the CPI, PPI, and PCE all they’d like, but Americans feel the pressure of inflation crashing on top of them. This index proves it. It has become more expensive than ever to buy a house. Home prices have also increased more rapidly than they ever have. In time, this will discourage buyers and we’ll have a correction, but for now buyers are still plentiful.

I got a few questions after yesterday’s post about gold. I thought I would address them here.
Isn’t a 70%+ change in the gold price extreme? Especially over a short period of time?
I agree that this would be extreme but it is not unheard of. In early 1973, gold gained 29% in the month of February alone. It then gained 26% between the end of April and the end of May. Gold repeated this pattern at the end of 1979. The price of gold went from $290 on August 1 to over $600 after the first of the year. That’s over a 100% gain in a little over 5 months!
Like you, I’ve been burned by gold before. How can we know that this time its for sure?
Unfortunately, we can never know anything in the market for certain. This is because the market is driven by people. People can be illogical in their convictions and this can drive prices to extremes, both high and low. Benjamin Graham said it best when he stated, “in the short run, the market is a voting machine, but in the long run it is a weighing machine.” The market weighs the value of the qualities of commodities and businesses but in the short run, all that matters is the momentum of the herd. I am convinced that the math of negative real interest rates is in gold’s favor and in time, the herd will notice.
How will we know when the right time to sell our gold is? What indicators do we look at?
The stock market is one part math and one part psychology. I believe the top in gold will show itself when the math begins to work against it (no more negative interest rates) and the herd believes inflation has been quelled. Both need to occur and when they do, the top will already be in.
Also, I’m reminded of an old Wall Street adage. It was that you sold when everyone was optimistic about the business. “The time of maximum pessimism is the best time to buy, and the time of maximum optimism is the best time to sell.” So when all the economic pundits on TV believe that gold will continue to rocket into outer space, that will be another indicator that the time to sell has come.