

Money supply, moving at sloth speed
and the wave of repercussions


The money stock report came out this morning and it continues to show a slow drag.

A few things jumped out to me.
There were several downward revisions of recent data.
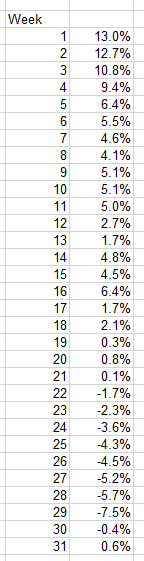
We have positive 13-week annualized money supply growth after 9 consecutive weeks of negative growth.
There was a dramatic drop to an all-time low reading of -7.5% before growth snapped-back to -0.4% the next week.
On the data revisions, there was not a dramatic change in the percentages. However, it does effect the denominator of future calculations.
On the streak of negative money growth, this is not new all-time streak. I went back and found three instances of longer streaks.
1992, weeks 21-32 for a total of 12 consecutive weeks
1993, weeks 5-15 for a total of 11 consecutive weeks
1995, weeks 5-14 for a total of 10 consecutive weeks
There are also an instance of a 9 week streak in 1994 from weeks 6 to 14.
In addition, 2009 had a streak of 6 weeks of negative growth, a week of positive growth, and then another 10 weeks of negative growth. That is a pretty impressive streak, 16 of 17 weeks.
This is not to say that our current streak is over. It would not take a very large revision to see week 31 go negative.
Finally on the snap-back, part of the dramatic rise was due to timing.

Calculating week 30’s figure saw the drop-off of week 16 from the formula. Week 16 was the most recent peak of money supply growth.

You can see above how truly anemic the money growth has been since week 16. From week 1 to week 16, the money supply expanded from 21,729.8B to 22,062.9B. The last 15 weeks has seen the growth collapse. Week 17 was at 21,620.4B and now week 31 is at 21,664.4B. That “growth”, between week 17 and 31, could easily be a rounding error that gets a revised away when the next money stock report comes out.
The stagnant growth in the money supply is causing serious repercussions around the world. The most obvious is the situation in Europe.

Since the Euro project began it has always been at a premium to the dollar. Only in 2015-2016 did it get close to parity. However, for over a year it has been getting its butt-kicked.

This has caused capital to come in from Europe to bid up assets in the US, primarily the stock market. A strong dollar has made the US the “cleanest shirt in the laundry hamper”. Even with all the recession warning signals going off the in the US, Europe is in much worse shape.
Imagine being a European right now. Where would you put your money? The German manufacturing businesses are all feeling the pressure from higher energy prices. BASF is readying “more ammonia production cuts” as the gas supplies get tight. Norsk Hydro is shutting down aluminum smelters in Slovakia. Why would they do this if aluminum is currently trading well above its 10-year average?

On top of this, the largest European Zinc smelter is halting production. This while zinc is trading in the top of its all-time trading range.

How many more European businesses and industries are in the same boat? My guess is practically all. The high costs of energy inputs are devastating for the European union and many businesses are feeling the pinch.
The continued tightening in the US and the devastation of Europe is going to be short-term bullish for the US stock market. I expect we’ll continue to see a wave of bear market rallies followed by pull-backs. Once the ECB gets crushed, a reckoning will come. At that time I expect commodities to absolutely shine and the US stock market to experience a serious pullback.

I had more of a Hacksaw Jim Duggan image in my mind for what the dollar is doing to the Euro. Drinking beer out of a can, taking a 3 point stance before charging at the prissy Euro and clotheslining it, then whacking it with a 2x4 for good measure before grabbing the American flag and waving it for the crowd. Hoooooooooooooooooooooooo!!!!!!!!!!!!!!!!!!!!!!!!!!!!!
Reading this prompted me to briefly look up money supply for the highest GDP countries, mainly on "tradingeconomics.com" a site which I'm not very familiar with. While I'm probably not comparing apples to apples with M2 for each country, a couple of things stood out: the federal reserve created one of the steepest M2 increases in 2020, and in 2022 is running one of the flattest M2 lines. DXY being up this year reflects this.
While the latest money supply continues to look very bad for stocks, it's probably going to be quite the roller coster ride.