Is the Fed up to it’s old ways?
On Tuesday the Federal Reserve posted the M2 data and it showed that the money supply was expanding at a 4.7% 13-week annualized average rate in week 32 of this year. This is up from 3.2% from the previous week. This is strong money supply growth. This means there is credit creation happening in the economy.
This week saw a good dump of data.
The Case-Shiller home price index showed that inflation did the dead-cat bounce.

After hitting 20% y/y in April 2020, the home price index slammed down to 0, then bounced back up to 6.5% in February of this year. It has now settled at 5.4% for the month of June.
Real gross domestic product in the US grew at an annual rate of 3.0% for the second quarter of this year according to statistics released Thursday of this week.

Strong growth was laid on the shoulder of increased consumer spending.
Thursday also saw the latest initial jobless claims (down 2k from previous week to 231k) and contiuning jobless claims (up to 1868k from 1855k previous week but below consensus estimates).

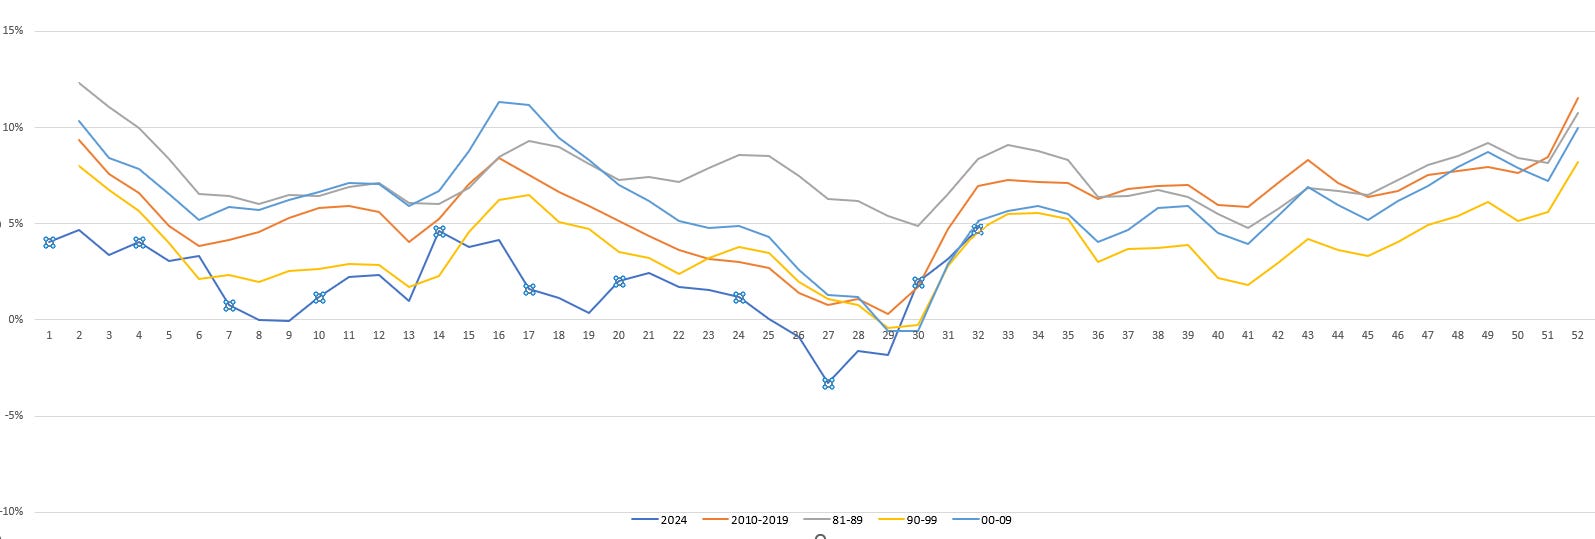
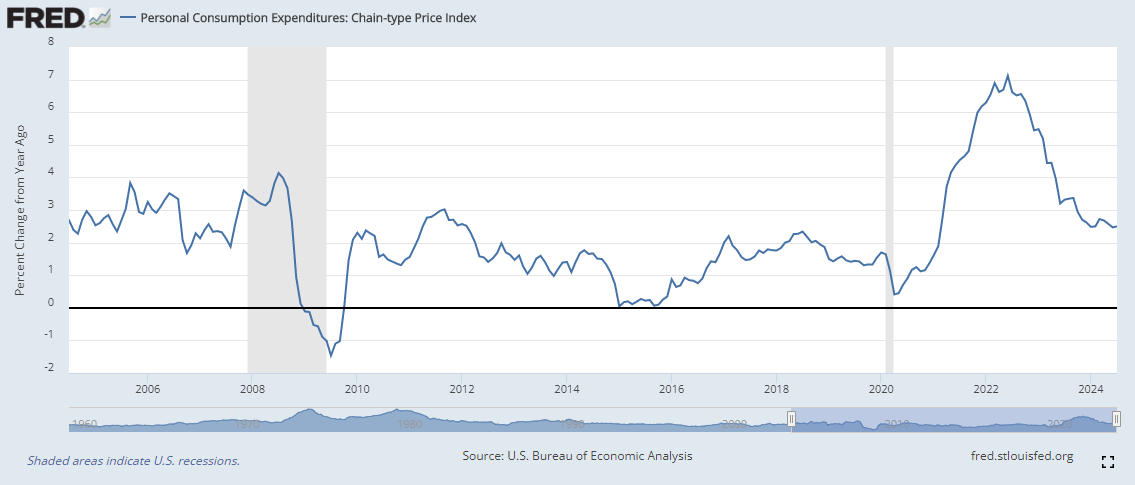
Finally it’s Friday and today we got the Fed’s favorite inflation metric, PCE.
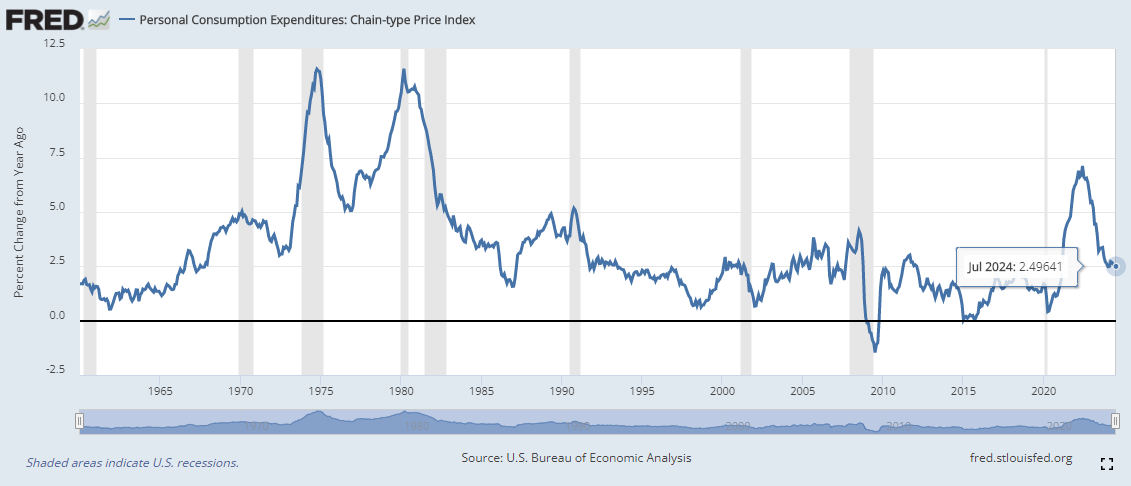
Coming in at 2.5%, is the PCE is signaling to the Fed that it’s ok to cut?
Or is progress stalling?
With the PCE data we saw the continued struggles of the middle and lower classes with reduced savings rates

and real disposable income.

The consumer is starting to show worrying signs. I’ve seen some troubling charts regarding credit card debt. Walmart’s earnings report showed that the consumer is trading down causing sausage sales to rise (what a weird trend). But this was certainly the most worrying of them all:

Now we get to play, Guess That Rate Cut!. The market is currently predicting 25 basis points at the September meeting. Then things get a little hairy.

But thats what makes this fun, right? RIGHT?