The state of the money supply

The Federal Reserve updated its H.6 Money Stock Measures data last week. Below is the 13-week annualized money supply report.

This is a very messy look because of the Fed’s reaction to the shutdown of the economy in 2020 to “slow the spread”. Here’s a look at just 2020-current:

The money supply got juiced to a record high 64.0% on an annualized basis in week 22 of 2020. Over the entirety of 2020, weekly M2 annualized money supply averaged 22.7%. 2021 stayed very hot at an yearly average rate of 12.0%. You can contrast this with prior years to see how outrageous this was:
2016 averaged 6.9%
2017 averaged 4.9%
2018 averaged 3.2%
2019 averaged 6.5%
2022 (averaged 0.5%) which is ties for second lowest with 1994.
2023 (-3.3%) was the lowest on record.
Because the 2020s have been so wild, I built an average to track against previous decades.

Trending this far below the past, I would assume that liquidity is drying up and that we are headed for a correction.
Printing money has consequences. To continue the party on wall street, a constant stream of new money is needed to bid up stock prices. When the supply increases, prices can and do go up. This is also seen in other capital markets. Its almost magical how closely annualized weekly M2 tracks the Case-Shiller Home Price Index.
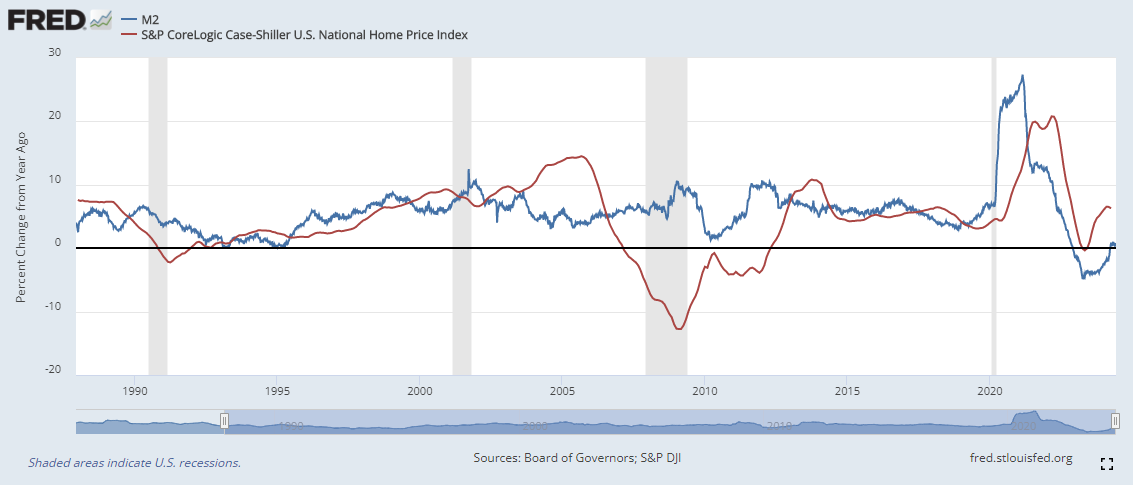
When the money printing stops, prices can no longer be bid higher. Sellers become plentiful, profits are taken, and buyers become scarce. A correction happens.
It is important to remember that printing money only impacts one side of the supply-demand curve. The consequences of printing money can be blunted by the demand for money. In Murray Rothbard’s “America’s Great Depression”, professor Rothbard laid out a handy little formula for understanding how changes in the supply and demand for money could reflect changes in prices. Here’s my cheatsheet:

There are several factors that can increase the demand for money such as; lower interest rates, increases in the supply of goods, and high inflation.
So how would we measure demand for money?
I feel this is one way.

Borrowing money to buy more stocks is a great way to juice returns on the way up. The left hand column is in $ millions. Currently traders are borrowing $809 billion dollars to increase their leverage in the stock market. That is a very bullish signal.
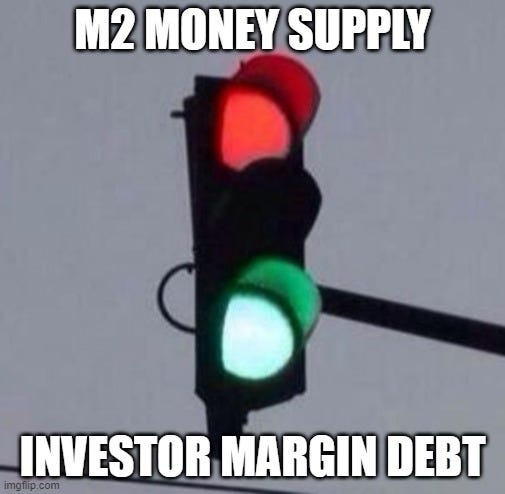
These indicators seem to be sending mixed signals.
So where’s all the money at?
Businesses had record earnings post-pandemic.
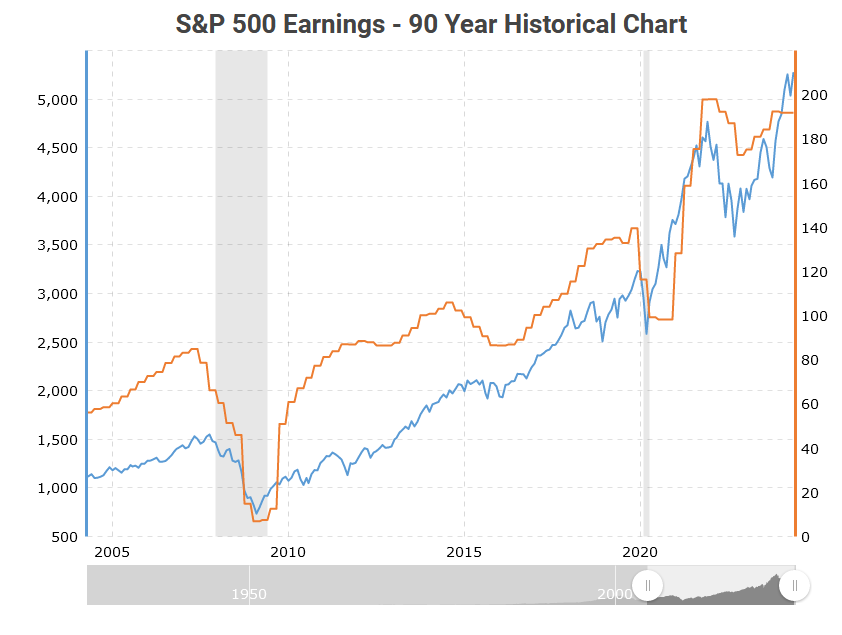
Now they are sitting on stockpiles of cash not knowing what to do.

Some of it is in T-bills and money market accounts. Businesses are trying to find ways to deploy it but the Biden administration has been hard at work stifling those efforts. They have put some of the “strongest ever” pollution standards on cars and “strongest ever greenhouse gas standards” in place. There have been lots of regulations on fossil fuels including power plants, methane emissions, LNG terminals, and offshore oil drilling. These are just some of the many regulations that have curtailed business development. Now what happens when all this gets unwound? What happens when businesses feel it is safe to deploy capital once more? Will a trickle turn into a flood? If so, what businesses would stand to benefit the most?
The overturning of the Chevron deference by the Supreme Court and the end of the Biden administration are both catalysts that could lead to a flood of capital being put to work in the economy.