

Anatomy of a bull market


Without much fanfare the bull market turned 2 years old this month. In the infancy of this bull market, many were predicting an imminent recession. This should have been a signal that the bottom was in (I needed confirmation that the money supply was going to get turned back on). When everyone shifts to one side of the boat, the market is likely to do the opposite. Which is exactly what played out.
Earnings season is happening again and the big banks are off to a hot start. Yardeni research shared this chart of earnings expectations.

While Q3 is only expected to be up 3.5% y/y, the Q4 numbers from analysts look very exciting at 11.2% y/y earnings growth.
I thought I’d look at the history of past bull markets to see if they could provide any predictions for this bull market. Forbes published at article in August that looked to provide a good start to the study. It outlined the period, length, cumulative return, max drawdown, and a brief history of each period. I put together the following chart:

I adjusted the period to an approximated start and end date and added a return per month calculation to see how hot the bull market ran. I see that the post pandemic bull market was the second hottest at 5.4% gain per month. The 3-mo bull market during the dot-com bust claims the crown for highest return per month at 7.1%.
Average bull market length was 59 months which is just shy of 5 years.
With this data I then built a heat-map to see which sectors led the bull market forward:
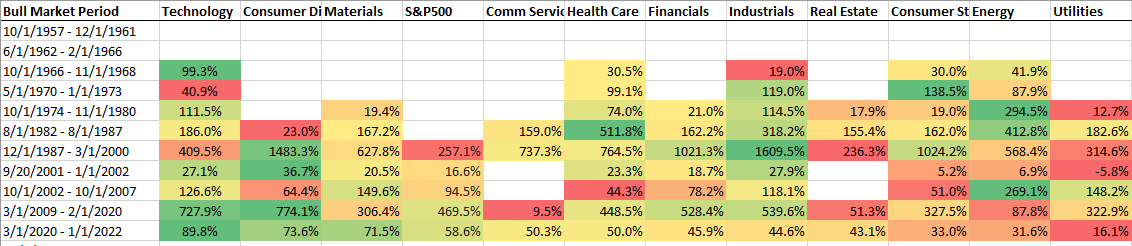
Here is a key for the sectors:

The sector ETFs do not have a long history. I had to make some substitutions for the older bull markets and didn’t complete the entire chart as finding good substitutions for entire sectors becomes increasingly difficult for the oldest bull markets.
The heatmap shows which sectors were hot by each bull market period. The color formatting works horizontally. Green is highest return and red is lowest. The color-coding and returns do not take into account dividends.
A few observations;
Technology isn’t always the hottest sector in a given bull market. This could be partly due to my substitution of IBM for XLK prior to 2000.
When energy is pushing the bull market forward, the consumer struggles (discretionary and staples both lackluster returns). This holds up logically as consumers would be spending more on energy costs and less on discretionary items. Also staples would see their margins compress as costs increase.
Don’t sleep on industrials. They seem to be able to have consistently above average bull market returns. The period of deregulation was especially good for industrials. This could also be a distortion due to replacing XLI with GE.
I built the heatmap with python on google colab and excel. The program I wrote also plotted out charts of the sector performance. Here is the chart for the latest bull market:

If past is prologue, this bull market should run for another 3 years.
Looking at margin debt usage, it began running higher October ‘23 then flat-lined in May (sell in May and went away).

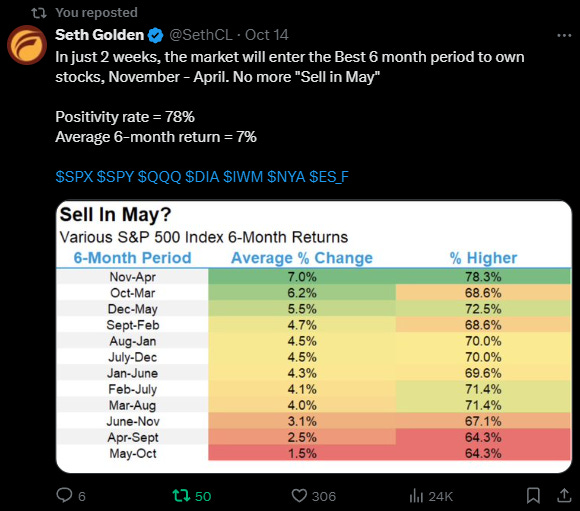
It is now edging higher. Are traders coming back to the market for the hottest time of the year? Is someone front-running the “best 6 month period to own stocks”?
Don’t fall asleep here, I feel the election outcome is still hanging like the sword of Damocles over the market. This is providing an opportunity to buy. The last time Trump got elected president, the market went on a tear. Here is a ETF sector performance graph from election day 2016 to February 2020.

