

Employment, Statistics, and Fed Fund Futures


This was employment week. Tuesday was JOLTs, Thursday was Initial and Continuing Jobless Claims (a weekly release), and Friday was the Unemployment Rate.
The lead chart is the ratio of job openings to unemployed persons and it seems there is an abundance of job openings (1.11 openings for every unemployed person).
On the Unemployment Rate, the mainstream financial news uses the seasonally adjusted number which came in at 4.2%. On a non-seasonally adjusted basis, the figure was 4.0%.

Another chart of interest was this one:

I had mentioned this chart back in August (full article here).
The above chart from the Bureau of Labor Statistics details workers who are employed and usually work full time. It had been a great indicator of recession when the percentage change went negative. Of course, we cannot have a recession without a republican president.

Thanks to
for bringing it back to my attention.I also stumbled upon this chart and found it to be statistically significant to the discussion.
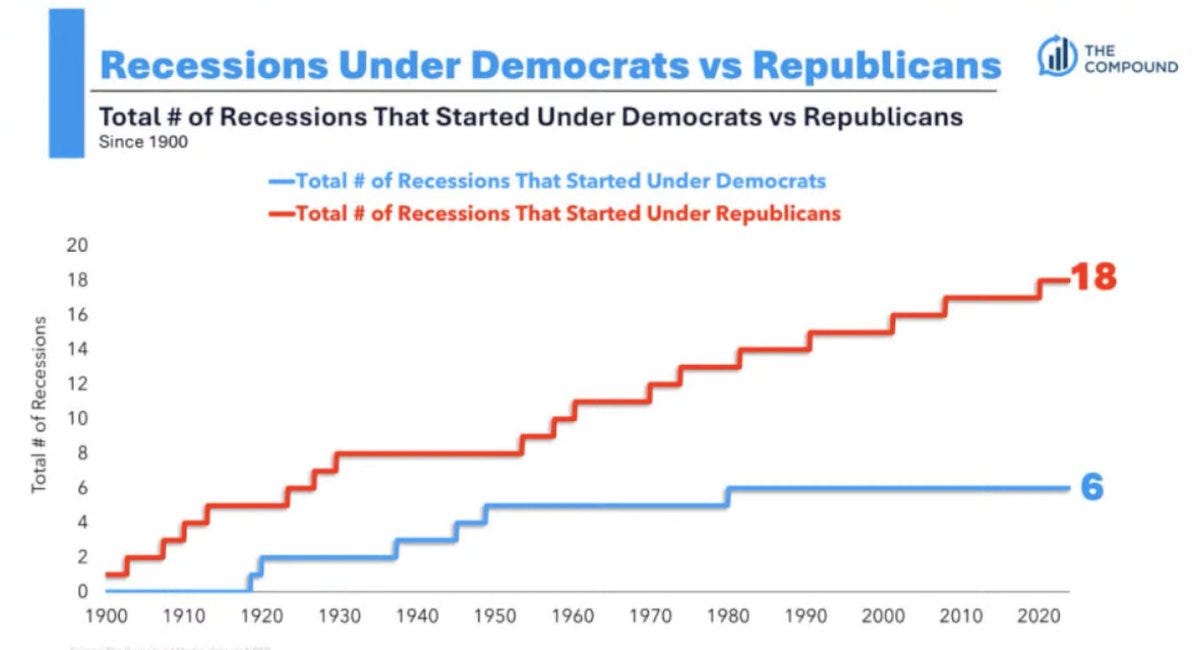
What is it about republican presidents that make them 3x more likely to have a recession?
With this week’s labor data in the books and the FOMC meeting just 11 days away, the odds of a rate cut have been pushing higher.

In addition to the labor data, Fed Governor Chris Waller’s talk at the AIER was influential. His prepared comments provided good insights into what the Fed is looking at going into the December meeting.
“In deciding which of these two approaches to take at the FOMC's next meeting, I will be watching additional data very closely. Tomorrow, we get the Labor Department's Job Openings and Labor Turnover Survey. On Friday, we get the employment report, which, as I noted, may have misleading payroll data. Then next week, we get consumer and producer price indexes for November, which will allow a good estimate of PCE inflation for the month. Finally, on the first day of the FOMC meeting, we receive retail sales data for November that will give us an idea of how consumer spending is holding up.”
Bold is mine.
Gov Waller then explained how he would vote.
“As of today, I am leaning toward continuing the work we have started in returning monetary policy to a more neutral setting. Policy is still restrictive enough that an additional cut at our next meeting will not dramatically change the stance of monetary policy and allow ample scope to later slow the pace of rate cuts, if needed, to maintain progress toward our inflation target. That said, if the data we receive between today and the next meeting surprise in a way that suggests our forecasts of slowing inflation and a moderating but still-solid economy are wrong, then I will be supportive of holding the policy rate constant. I will be watching the incoming data closely over the next couple weeks to help me make my decision as to what path to take.”
Cut and hold seems to be the play.
The Q&A was really good on this one (it starts at 18:30 in this video).
In other statistical wonders, I created this chart in Python that shows the average weekly percent change in the SPY ETF by week since 1993.

12 of the final 13 weeks of the year average positive gains to finish the year. It looks like the odds are in our favor.
