

FOMC cuts, stocks dump, and margin debt pops

Fed Chair Powell announced the FOMC’s decision to cut the fed funds effective rate to a range of 4.25% to 4.5% yesterday. This decision was highly telegraphed by Fed speakers over the previous month, most notably by Fed Governor Chris Waller who outlined the cut and hold approach back on December 2nd. I covered it here:

Gov Waller then explained how he would vote.
“As of today, I am leaning toward continuing the work we have started in returning monetary policy to a more neutral setting. Policy is still restrictive enough that an additional cut at our next meeting will not dramatically change the stance of monetary policy and allow ample scope to later slow the pace of rate cuts, if needed, to maintain progress toward our inflation target. That said, if the data we receive between today and the next meeting surprise in a way that suggests our forecasts of slowing inflation and a moderating but still-solid economy are wrong, then I will be supportive of holding the policy rate constant. I will be watching the incoming data closely over the next couple weeks to help me make my decision as to what path to take.”
Cut and hold seems to be the play.
Post meeting, the CME FedWatch tool has firmed up, showing only one cut in 2025.

Accompanying this meeting was a ‘Summary of Economic Projections’ (SEP). This is data from Fed members on where they see future monetary policy, inflation, employment, and GDP. This data was an update from the projection materials that were put out in September. The Fed puts out this material on an every-other-meeting basis. Understand that these projections are just a guess. Just like any estimate, the further out the projections go, the less accurate they become. I feel Chair Powell says this at every press conference after SEP data is released and this press conference was no different. The most important part of the SEP is the estimate of the future monetary policy target rate.

Comparing September’s SEP to yesterday’s release, you can see a big change has happened. Fed members tightened up on their ‘25 estimated rate and they’ve all moved higher. Fed members went from an average fed funds effective rate of 3.35% to an average rate of 3.84%. This was a big shock to the stock market and sent the VIX higher and the major indices (SPY, QQQ, IWM) all lower. This dump in stocks was due to traders adjusting to a lower equity risk premium. Investopedia breaks it down this way:
“Equity risk premium is the excess return that investing in the stock market provides over a risk-free rate. This excess return compensates investors for taking on the relatively higher risk of equity investing. The size of the premium varies and depends on the level of risk in a particular portfolio. It also changes over time as market risk fluctuates.”
The thinking goes, if rates are higher, bonds should look more attractive as they have less risk than stocks.
What stands out to me is that the CME FedWatch tool only shows one cut in 2025 while the SEP projection shows two. It seems that the market is underestimating the Fed’s willingness to lower rates. They’ve been spooked by the ‘higher for longer’ mantra and now refuse to believe the data in front of them.

I have mixed feelings on the presser after the meeting. I thought that there were several members of the press that asked thoughtful questions. Leading off, Jeanna Smialek did a great job getting Powell to talk about the timing of future cuts and what data the Fed would be looking at. Howard Schneider was able to get good information about why the Fed is looking to pause here.
Jerome Powell: “So, we have a people making a bunch of different approaches to that. But some did identify policy uncertainty as one of the reasons for their writing down more uncertainty around inflation. And, you know, the point of that uncertainty is it's kind of common sense thinking that when the path is uncertain you go a little bit slower. It's not unlike driving on a foggy night or walking into a dark room full of furniture. You just slow down. And so that may have affected some of the people, but as I said, there's a range of -- range of approaches on the Committee.”
After that there were a few mediocre questions and then it quickly fell off a cliff. One interesting anecdote was when Chairman Powell shared an additional data point he was looking at. He said, “I think it's pretty clear we've avoided a recession [in 2024]. I think growth this year has been solid, it really has. PDFP, Private Domestic Final Purchases, which we think is the best indicator [of] private demand is looking to come in around 3 percent this year. This is a really good number. Again, the U.S. economy has just been remarkable.”
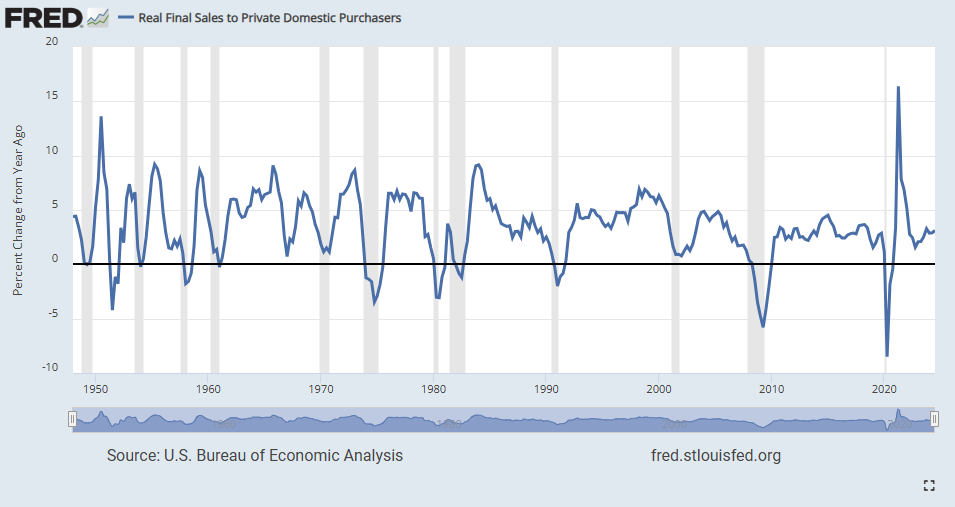
As Powell indicated, private demand continues to remain strong. It rebounded from a low of 1.57% in Q4 of ‘22 and currently is running at 3.1% (data last updated today, Dec 19th). I am taking note here that a sudden drop in demand has regularly coincided with a recession. It would be interesting to map this statistically against the stock market.
A final data point to leave you with was FINRA margin debt use statistics. FINRA posted the data this week and use of margin debt shot higher in November.

Margin debt use was up 9.3% month-over-month to over $890 billion. The month-over-month size of this increase is a rare feat. Margin debt statistics have only been kept since 1997 but during that time, a month-over-month increase of 9% or greater has only occurred 11 times (a 3.58% occurrence rate). I ran the statistics to see what the average forward returns were:

While the 1-month average return and hit rate looked poor, the 6-month forward return and hit rate looked very appealing (hit rate is the instances of positive outcomes divided by the total number of instances). I decided to map the 6-month outcomes in a bell curve.
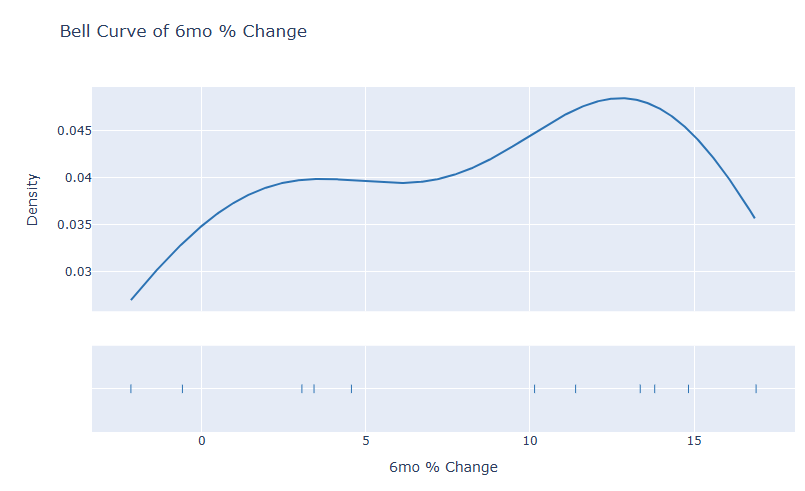
The curve peaks around a 6 month change of 12.7%-12.8% with a density of just under .05. I find this to be significant but I’m worried about the small pool of data because I only have margin debt statistics going back to 1997.
Here are the years and months of the 11 instances when margin debt went higher than 9% month-over-month:
['1999-01', '1999-04', '1999-11', '1999-12', '2000-02', '2003-06', '2006-11', '2007-05', '2013-01', '2020-04', '2020-11']
I’m thinking that traders got excited about the prospects of a second Trump presidency. They may have also wanted to front run the Santa rally. Margin debt use is fuel for a run higher in stocks but it can cut both ways. When traders unwind margin debt use it often leads to stagnant or falling stock prices. It’ll be important to see if this can fuel a bull run and if margin debt use picks up.
I'm still looking uneasily at the yield curve, which at long last has come out of inversion:
https://fred.stlouisfed.org/graph/?g=1CqHO
https://x.com/BobMurphyEcon/status/1869524763384975742
Will the no-fun Austrian school perma-bears finally be right this time?