

Inflation, income, savings rates, and inflation expectations
and an interesting take on stock picking


The personal consumption expenditures (PCE) index was published today for the month of August. This has been touted as the preferred method of tracking inflation by the Federal Reserve. Previously, I exposed the faulty math of the Fed and how they manipulate the data. They massaged the data into an 18-month annualized basis. This means that the PCE will need to be higher for longer before they will feel pressed to act. Here is what today’s data release looked like:

This shows a 3.6% year-over-year increase. You would need to go back to 1991 to have a comparable figure. The month-over-month change was 0.3%. Inflation is creeping into the everyday purchases of Americans and they are starting to do something about it. The personal savings rate is beginning to return to normal.

August’s data shows a reduction to 9.4%. We are getting close to the 10 year average of 8.6%. Prior to the government shutdown and transfer payments, the 10 year average was 7.3%. This means people are spending their money. Are they feeling the heat from inflation or are they moving past the Covid fear? To me it doesn’t matter. Consumers are spending money and their income is going up.

The red trend-line is mine. From it, you can see that we are still punching above the previous trend. The math is simple; more income equals more spending which equals more inflation. Consumers are starting to get it too. You can see this in the University of Michigan’s consumer sentiment survey. According to their survey, the population has an inflation expectation for the year ahead at 4.6%. The 5-year outlook rose to 3% from 2.9% in the prior month.

This is the highest long-term inflation expectations in a decade and expectations matter. At some point, consumers will act on these expectations of higher inflation. When that happens, gold and silver will have a big tailwind.
Finally, I want to get to a project I’ve been working on. In an effort to figure out which stocks have the most momentum, I’ve been working in RStudio to bring an analysis of companies in specific fields that reflect the strength of their price changes. Both Norman Fosback (“Stock Market Logic”), and Gerald Loeb (“The Battle for Stock Market Profits”) emphasized that there are certain stocks that have stronger price moves than others that are in the same sector, industry, and sub-industry. My first target was coal. I took the top players in the field and put them to the test. I used data from 11/28/2017 through yesterday. Here is what my data shows:
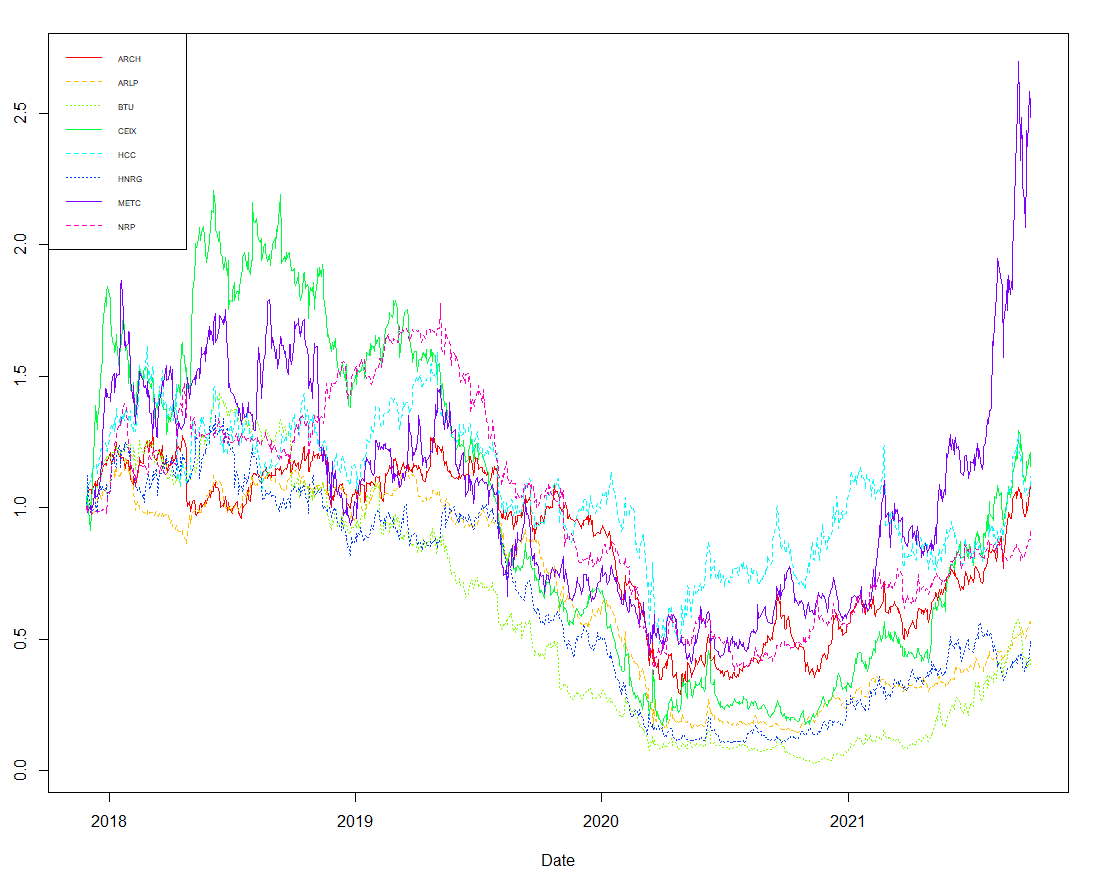
Since November of 2017, METC (Ramaco Resources) has had the strongest price moves. Prior to the government shutdown in 2020, CEIX (Consol Energy) was the strongest mover. So I took my data and upped the date to January of 2020 through yesterday and it showed the same thing.
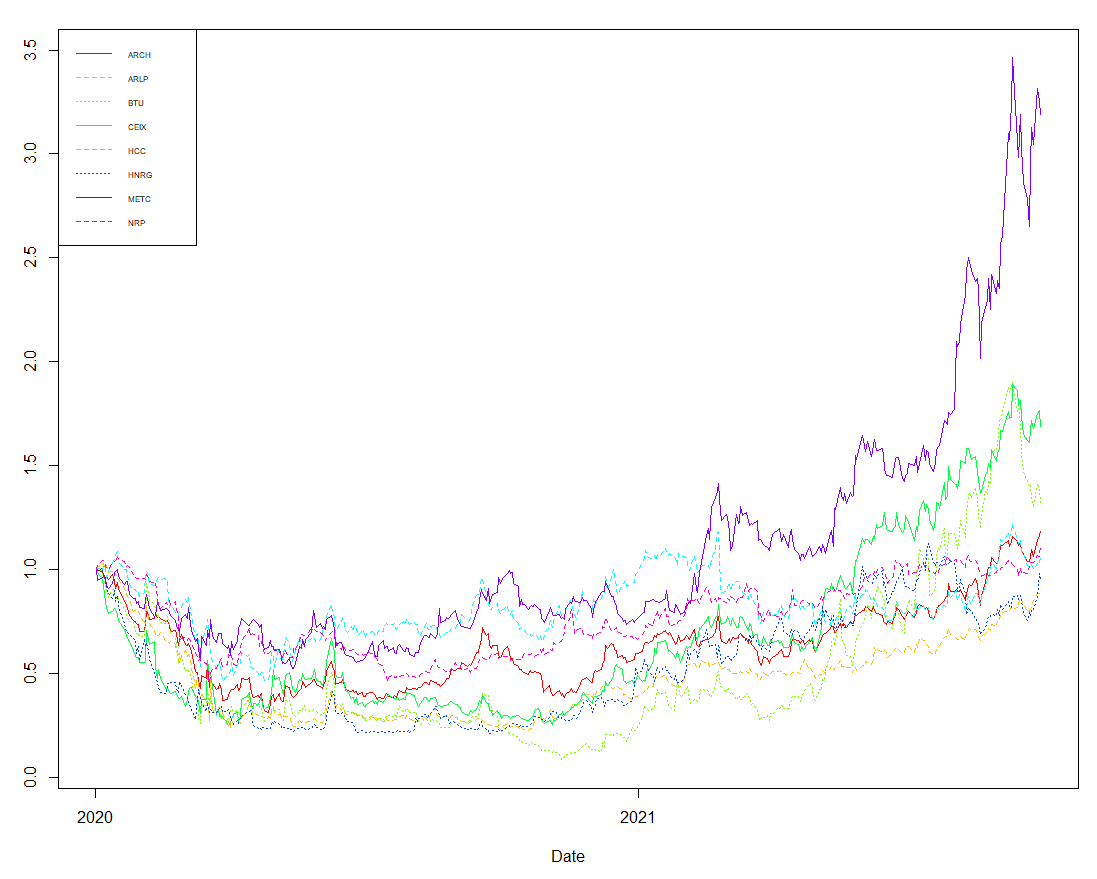
METC seems to be the stock for coal. This was pretty evident before, especially with today’s monster move. CEIX is a distant second place. The rest trail these two leaders.
After looking at coal, I decided to do the same with uranium. This proved a little trickier as NXE only has data that goes back to August of 2013. When this is plotted is shows a distinct advantage to NXE due to their very low August 2013 IPO price.

If you had bought NXE at the IPO and held it to date, you would be holding, what Peter Lynch would call, a 10 bagger.
I thought this was a little unfair to the other uranium miners so I decided to cut the date down to 2020 through current to see if NXE still had this kind of momentum.
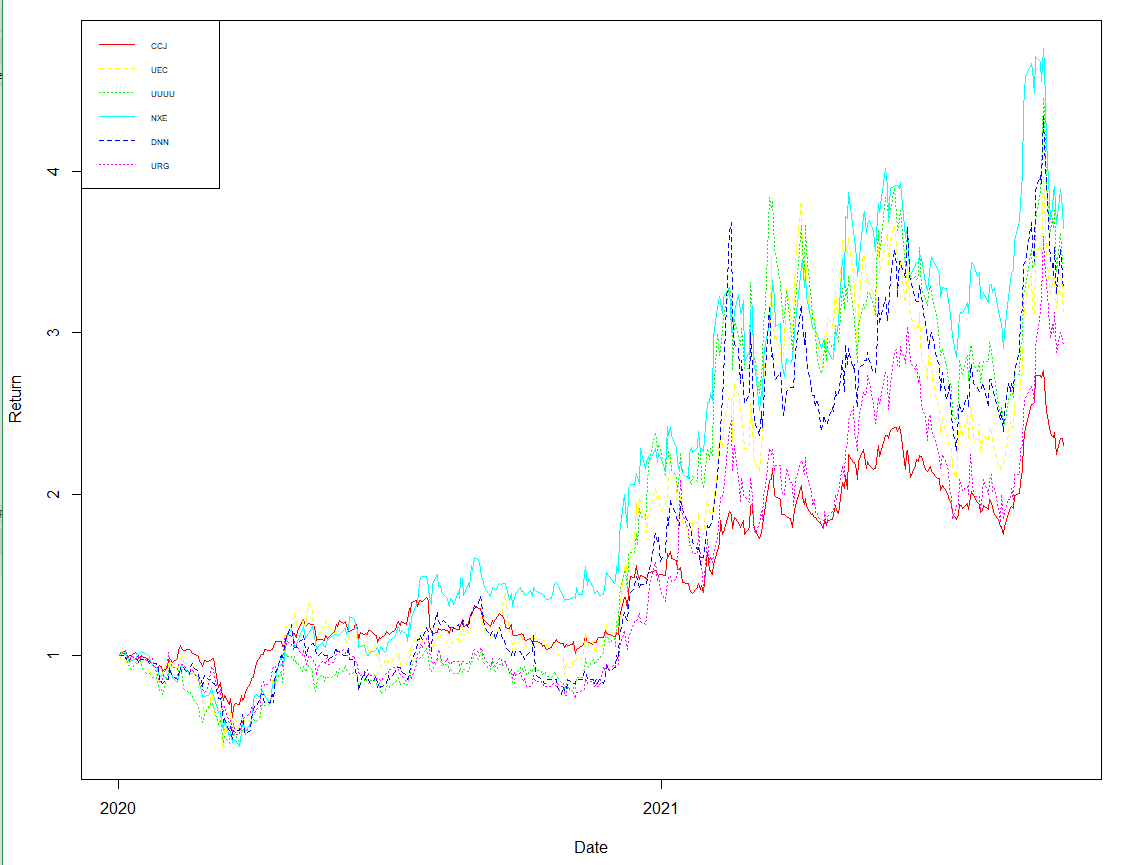
This showed that the race was much tighter. While NXE still has the top spot, UUUU and DNN came in a close second and third. It seems the largest of the uranium miners, CCJ, is the laggard of the field.

Great stuff. Thank you for the uranium stock analysis. Very helpful.