

Money Supply and the Yield Curve
it is not a pretty picture


The Fed is set to hike rates tomorrow and a lot of traders are positioning for the interest rate announcement but today’s money stock report was what I was looking forward to. The Fed updates their M2 money supply figures on a monthly basis. M2 is important to track as it is the money out there that is bidding up goods and services. However, what we are seeing now is the reverse.

Above is the chart of the last 10 years worth of 13-week annualized M2 money supply data. You can see that there was a pattern to the money flows until 2020 when the supply of money soared. 2021 was also a high year but it followed the traditional pattern. 2022 broke from that pattern at the beginning of May. It has trended lower ever since. Even the revisions to the M2 data have all been lower. This is bad news for the markets. Here are the figures year-to-date:

The money out there that is suppose to be bidding up goods and services is shrinking. This is going to end very badly. I was shocked at the reading back in June but now that shock is moving towards horror. The market is anticipating a reversal from the Fed when things get bad but the Fed is going to be slow. The Fed knows that they screwed up on inflation and that they need to get it under control. They are willing to tolerate a mild recession to get it done but what the money supply figures show is that a chance at a mild recession went out the window back in May. Bond market investors are picking up on this. David over at LiveBetterNow covered this in his, “Checking in on the Yield Curve”.

My comment to him was that the 30-year minus the 3-month constant maturity treasury would take the 10-2 idea to the extreme.

It has been crashing on a rapid pace. As you can see from the bigger picture, it has a tremendous track record of indicating an oncoming recession.

Both the 10-2 and 30-3mo curves show us that short-dated bonds are being bid up because investors are worried about the future. There is something happening in the market and they are trying to protect themselves with shorter-dated bonds. Both curves are prone to double dip. Here’s a breakdown of the approximate dip date versus the approximate date the recession was officially announced to have started.
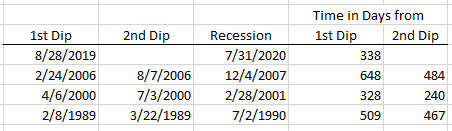
This analysis makes it look like there is still a lot of time before things get really bad but I would caution against such conclusions. We are seeing rapid deterioration of the economy. Much more rapid than prior recessions. Housing prices are going down during what is typically the hottest time of the year for house sales. Vehicle sales have stalled and repos are on the rise. Tomorrow sees the Fed interest rate announcement but also the durable goods report. I imagine we’ll see this in decline as well. At the same time, Janet Yellen still can’t see any signs of a recession.

+1 for the Janet Yellen skewering
Would you reckon that a stock market crash is more likely to happen _before_ or _after_ October 1 of this year?