

The keys to the market
and why they are important


Over the years many people have developed stock market indicators that they believe are the key to stock market success. Some of these include; Price/Earnings ratios, the yield curve, short interest ratios, put/call ratios, margin debt, market breadth, overbought/oversold indexes, moving averages, and volume indicators. Some of these indicators I believe have something to them, others I believe are a waste. It takes patience and practice to determine which indicators are important and exactly what they are telling you. The big four for me are the yield curve, M2 money supply, IPOs, and margin debt. Let me break it down further.

The yield curve is important due to its ability to forecast if banks are able to lend money at a profit. When banks lend money, they are doing so by borrowing short and lending long. It is profitable for banks to do this when near term rates (like the 2 year treasury) are lower than the long term rates (like the 10 or 30 year treasury). This process expands economic activity and the money supply as banks must borrow this money into existence. Below you can see that we are still in positive territory where the yield curve is concerned.

At 105 basis points, we are looking good.
My second indicator is the money supply. I posted about it yesterday when the figures got published.

My key to this indicator is watching the progression of the supply. There is a seasonal flow to it through the year. It does not stay constant. This can make it a difficult indicator to follow and interpret. For me, with a M2 money supply reading of 8.0%, we are in a very positive territory.
My third indicator are IPOs. IPOs are initial public offerings. These are companies that have decided to go from being privately held to publicly held companies. An IPO is usually managed by a big investment bank like Morgan Stanley or Goldman Sachs. These banks help the company make sure their paperwork is in order and that they’ll get listed on the exchange. Lately many special purpose acquisition companies (SPAC) have been listing IPOs. These are companies that will get a listing, then they will purchase a company to bring it public. It is a backdoor to taking a private company, public. There are a few places to check the latest IPO activity. Here are three of my standbys; MarketWatch, Stock Analysis, and Nasdaq’s website. The reason this is an important indicator to me is that companies do not want to go public in a down market. They want to see their stock take off and have the public clamoring for more. When IPOs begin drying up, it is a sign to me that companies are worried about the prospects for higher stock prices. A quick glimpse shows that there have been many recent IPO filings with more on deck. This is a good sign.
My final indicator is margin debt. I lightly touched on margin debt a few days ago. I was really nervous at the time because it was looking very grim and my money supply data had grown stale. I’m really sour the Fed has stopped updating the money supply figures weekly and will only update it on a monthly basis.
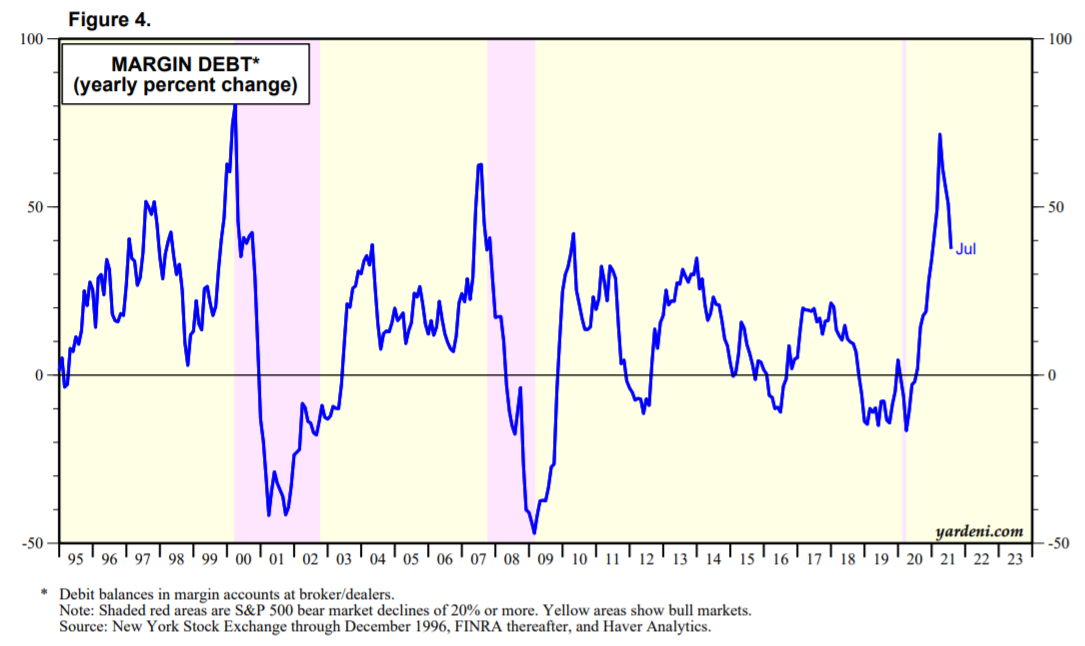
Margin debt is an important indicator because it shows how confident investors are that stock prices will continue to rise. Traders are able to borrow on margin by using the stocks in their portfolio as collateral for a loan to buy more stocks. This can really get the market hot in a hurry. It also works in the opposite. Once levered up, investors only have two options, deposit more money to buy more stocks or sell. As you can see from the graph above, once the selling starts, it can be fast and furious. It also looks like the selling has already begun. Margin debt peaked in late April. Of all the indicators I follow, this one has me the most nervous. It is rare to have such a steep drop in margin debt and no correction in the stock market. It is something to keep our eyes on as we move forward towards the end of the year. I check margin debt here at Yardeni Research.
I am a believer in more than just these four. However, to me, these are the most important of all the indicators. They can give you a fuller picture of the market and help you prepare for the bumps and turns. There is a time and place for fundamental analysis (P/E ratios) and technical analysis (charting) but it is best to determine the direction the market it headed before you wade out into deeper analysis.