Housing Data and Margin Debt statistics
Is a 100 basis point move still on the table for July's FOMC meeting?
We are starting to get data coming in that the housing market is peaking. The first data point comes from Redfin which shows that the median sales prices are starting to slip.
I wrote that pressures in the housing market were beginning to mount back in May (here and here). Now Redfin is confirming this data. Not only are sales prices coming down, but also asking prices.
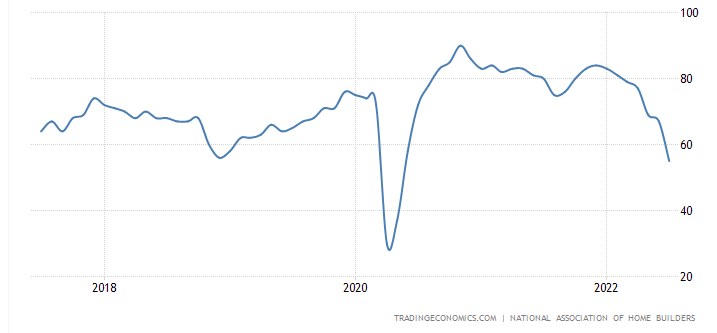
Yesterday the National Association of Home Builders (NAHB) released their housing market index showing a reading of 55. This is the lowest reading of the index since May 2020.
The NAHB Chairman, Jerry Konter, had this to say about the report.
“Production bottlenecks, rising home building costs and high inflation are causing many builders to halt construction because the cost of land, construction and financing exceeds the market value of the home. In another sign of a softening market, 13% of builders in the HMI survey reported reducing home prices in the past month to bolster sales and/or limit cancellations.”
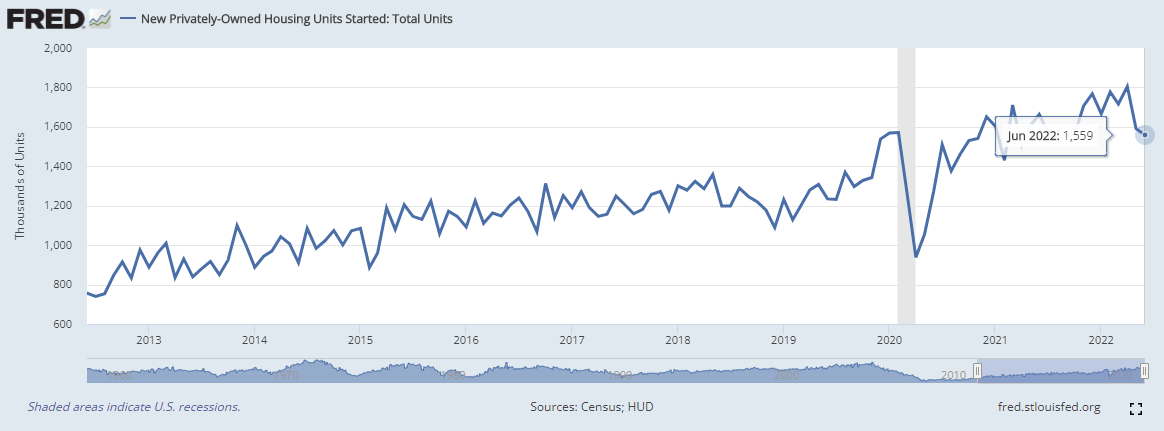
Today saw housing starts and building permits data for June. It seems to indicate more of the same. Starts were down 2% month-over-month which is hte lowest since April of last year. Permits saw a decline of 0.6% which is the lowest since September of last year.
All of these statistics will weigh heavily on the FOMC which meets next week. If you recall, it was Fed Governor Chris Waller who said that,
“If that data (housing and retail sales) come in materially stronger than expected it would make me lean towards a larger hike at the July meeting…”
So far it looks like retail sales are still strong but housing is falling off a cliff. This makes me lean towards Waller’s “base case” for July of a 75 basis point increase in the Fed Funds Rate. This seems to be what the CME Group’s FedWatch Tool is indicating.
Even though retail sales exceeded expectations, housing might be the stumbling block that prevents the Fed from going with a 1% rise in the FFR. Even if they increased the FFR by 1% to 2.5%-2.75%, I’m doubtful that this will do much against 9.1% inflation.
In addition to housing demand slowing, so is margin debt.
Margin debt use dropped by almost $70 billion month-over-month. This is nothing like the modest drop we saw at the end of 2018. It was a 9.2% contraction month-over-month. This was a big time adjustment and it showed in the stock market for the month of June which was down 7.9% on the month (S&P500).
Margin debt can be a powerful driver of the stock market. When it is increasing, stocks get bid up. It can also have the opposite effect, which we are seeing right now. Something drastic is going to need to happen to turn this ship around. We’ll get a good look at the money supply next week. That should give us better direction.


That is an aggressive drop in margin! If there ends up being enough of a bear market rally to fill the upside gaps on the indices - which isn't too much of a leap, I'm probably going in TQQQ puts.