

A bounce in margin use
and a bounce in equity exposure


Margin debt use statistics were posted by FINRA this morning. I like to keep track on margin use as it is a great indicator for investors appetite for risk. Margin debt is when investors borrow against their stock holdings in order to purchase more stock. The higher margin debt climbs, the more money is hitting the stock market, the more money is being pumped into the system. However, when margin debt starts to drop, its a signal that investors are losing confidence in the market. This cycle lower can become self-fulfilling as investors reduce stock exposure causing the market to turn lower.

You can see we got a bit of a bump in July from the frantic selling pace of the previous month. The general trend continues to be lower.
FINRA also provides us with the Free Credit Balance. This is what I call the “sideline money”. This is money that is in brokerage accounts that can be readily used to buy stocks.

We can see that there was a big drop in the Free Credit Balance from June. Investors have reduced their sideline money in a pretty significant way but there is still plenty available for stock purchases. This is a trend to keep an eye on.
I have a feeling that a large part of the drop in the free credit balance was retail investors piling into the stock market to “buy the dip”. The Fed and many TV financial pundits have been training the retail money to buy every dip as the market then rips higher. This worked during the entirety of the march higher for the stock market. It worked because of the positive yield curve, higher margin use, and (most importantly) money supply growth. Now these tailwinds for the market have turned into headwinds. The recent rally in the market largely looks like a bear market bounce.

The market can’t finish out its full correction until we have a “return to normal” situation.

I shared this last in June. At the time I had said that we were somewhere between denial and return to “normal”. I believe we are getting very close to the top of that return to “normal” phase. We see this in the recent march higher for equities while housing, productivity, money supply, and the yield curve say that the market should be going the other way. I believe part of this run higher was fueled by retail investors but part of it has also been fueled by active investment managers.
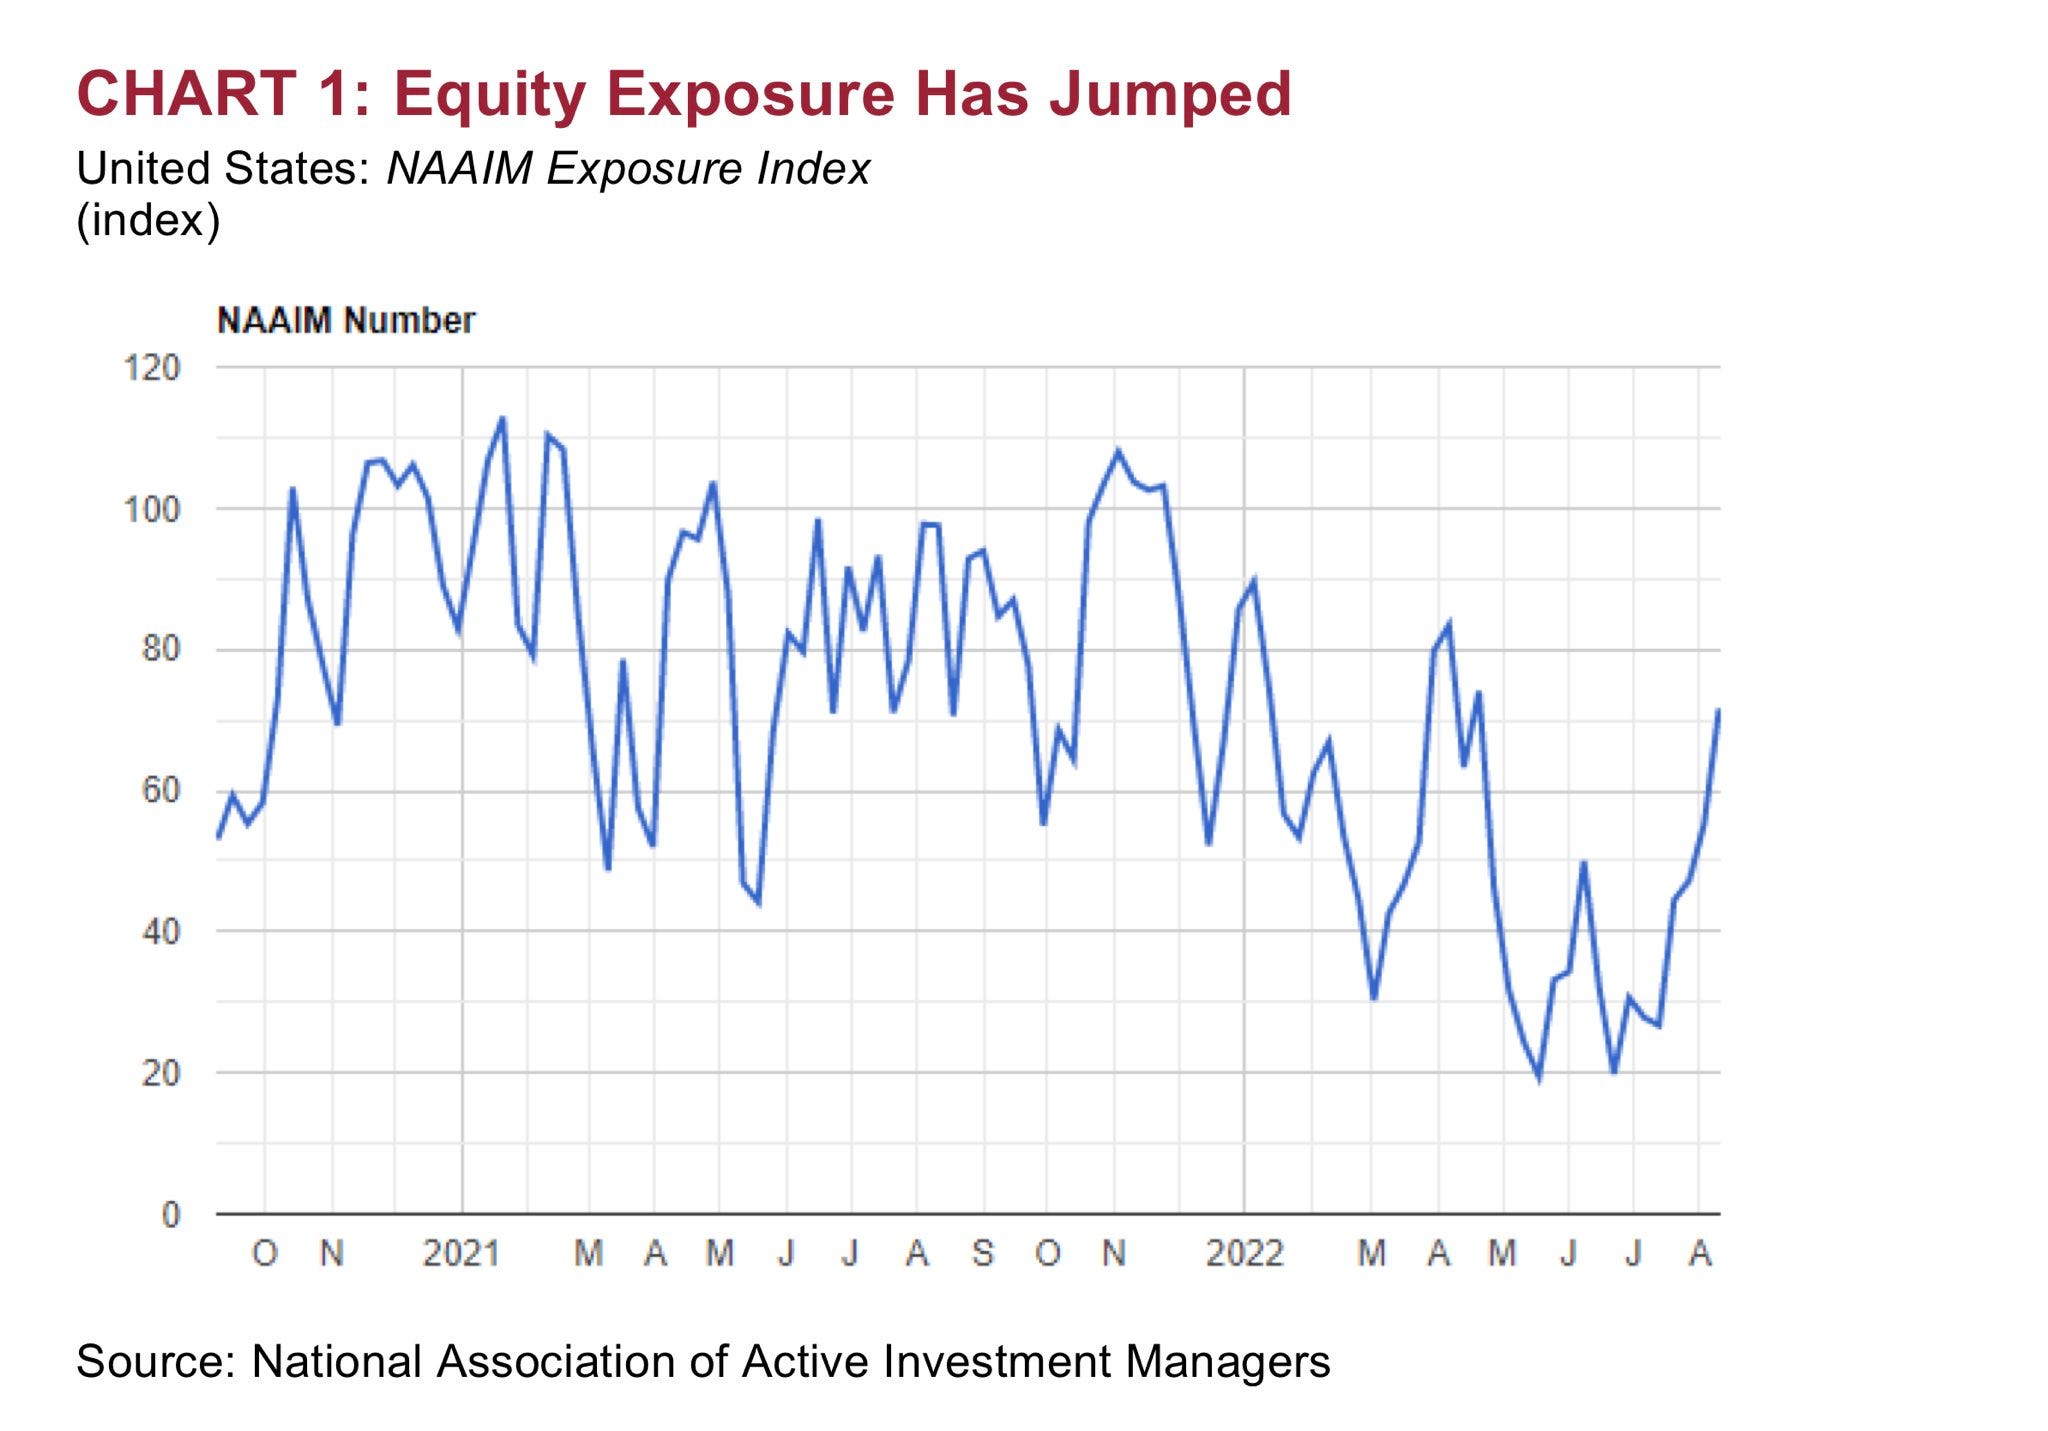
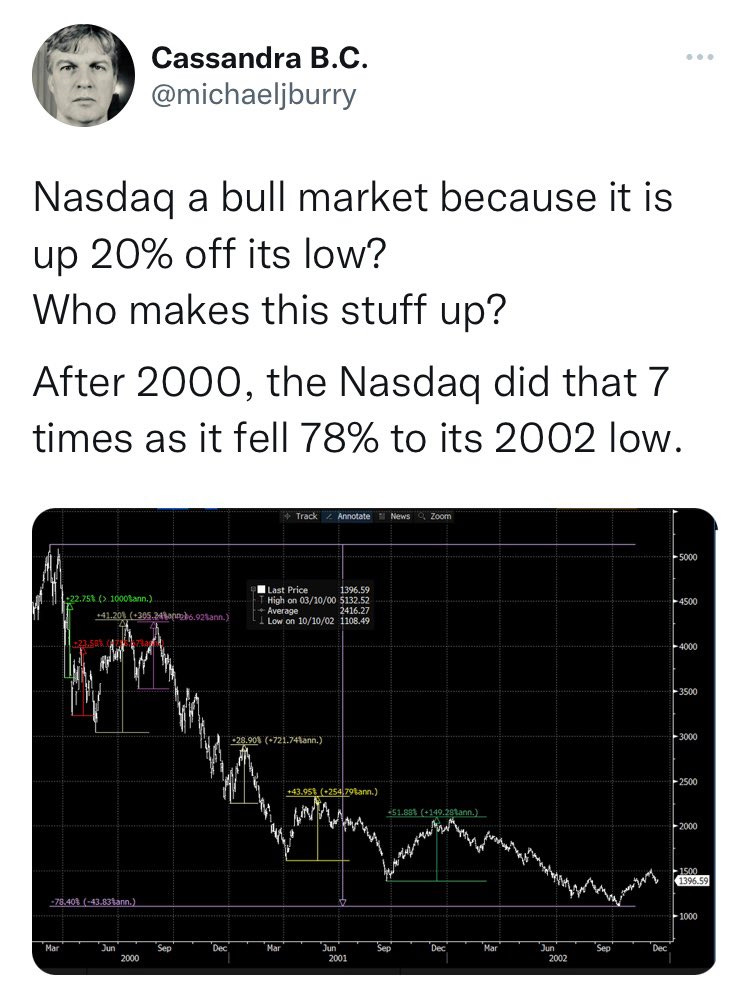
The National Association of Active Investment Managers (NAAIM) is showing us that active managers of investor money have been putting it back into the market. They are back to 70% levels. This is a significant bounce. It is significant because it is a large amount of money that has been put back to work in the market yet the market is still below its all-time high. It is only after everyone has been sucked back into the market will it then turn lower. Michael Burry pointed this out in a recently deleted tweet.
An interesting note on my favorite doctor, hedge funds were required to file their 13F forms on Monday. These are the forms the SEC requires that show the holdings of large market participants. Dr Burry’s showed only one holding, The GEO Group (GEO). What made this particularly interesting is that the 13F form doesn’t show shorts. Of Scion Asset Management’s $291,659,289 of assets under management, only $3,309,000 is put to work in GEO. That is roughly 1.1% of total capital under management. What do you want to bet that the rest of those funds are short the market in some fashion?

Too bad he isn't holding puts this time, I'm certainly curious where the rest of the money is at